


 15 / 352

RESORT DIRECTORY 2014 – 2015
13
IntervalWorld.com
VACATION PLANNING WITH THE TRAVEL
DEMAND INDEX
To assist you in planning your next
vacation — whether you are exchanging a resort week, or
purchasing a Getaway, vacation package, or other travel
products — Interval’s Travel Demand Index will help you
determine when the best opportunities for travel are likely to
be available.
TRAVEL DEMAND INDEX
With the differences in worldwide travel patterns, it is often difficult to
know when the best travel opportunities exist in a particular destination.
The Travel Demand Index will help you make vacation plans by showing
relative weekly inbound leisure demand for themarket areas in this Directory.
When you place an exchange request or attempt to book any other
travel reservation, the Travel Demand Index can serve as a useful guide
by demonstrating the historical strength of demand in a given area during
each week of the year.
HOW IT WAS DEVELOPED
The Travel Demand Index reflects historical hotel and resort data on
occupancy and average daily rates, supplemented by historical relin-
quishment and redemption data experienced by Interval’s Quality
Vacation Exchange Network. This information serves as a good indicator
of the demand for accommodations and inbound leisure travel patterns
in a given area, and will help you plan your vacation.
HOW IT WORKS
The Travel Demand Index consists of seasonal indexes presented on each
of the region introduction pages in this Directory.They can also be found
online at IntervalWorld.com. Each area in the region is assigned a
numerical index for every week of the year, with 100 representing the
average inbound leisure travel demand. The higher the figure is above
100, the greater the relative leisure travel demand for the area during
that week. Numbers below 100 indicate periods when it may be easier to
confirm exchange accommodations and less expensive to reserve other
travel services.
The seasonal indexes reflect the cycles of leisure travel demand over
the course of a year. For example, higher seasonal indexes in winter peri-
ods are typically observed in regions that are beachfront warm-weather
locations or ski destinations. Some peaks are associated with tourist-
drawing events that are held regularly during specific weeks. Of course,
holidays, special events, and other highly desirable vacation periods typi-
cally have higher relative demand for leisure travel services such as
accommodations, and higher rates within those specific weeks. And,
floating holidays may occur during different weeks from one year to the
next. In addition, in any given year, the actual demand patterns may devi-
ate from historical trends due to severe weather disturbances and other
unpredictable events.
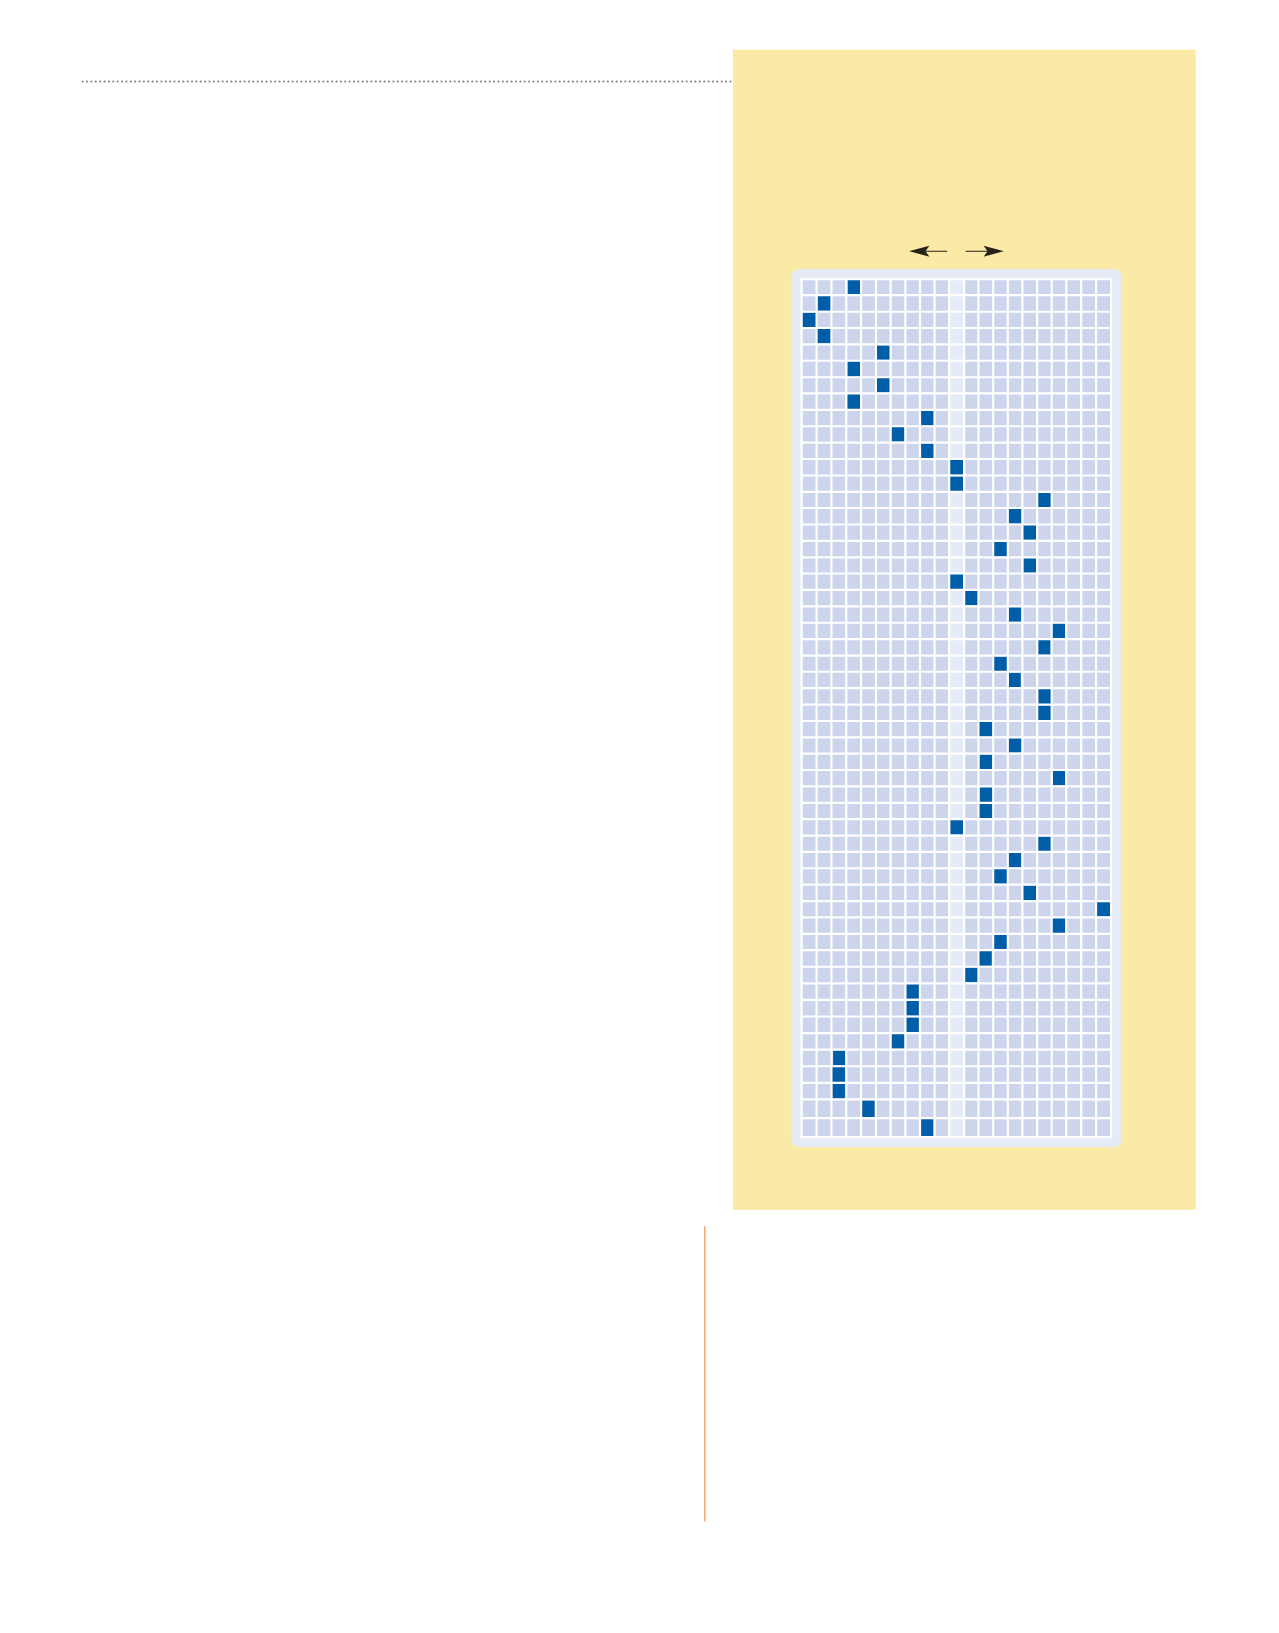
SAMPLE TRAVEL DEMAND INDEX
50
100
150
1
2
3
4
5
6
7
8
9
10
11
12
13
14
15
16
17
18
19
20
21
22
23
24
25
26
27
28
29
30
31
32
33
34
35
36
37
38
39
40
41
42
43
44
45
46
47
48
49
50
51
52
Market Average
Greatest
Availability
Greatest
Demand
WEEKS
HOW TO READ THE
TRAVEL DEMAND INDEX
Use the Travel Demand Index when you are
ready to plan your next vacation. It is a
valuable and easy-to-use tool. Consider the
seasonal index above for a typical market
area. In this example, the index indicates
that the best prices and availability historically
are found during week 3. During week 39,
prices will likely be higher than average and
availabilities more limited.