


 10 / 56

Key indicators from the
AIF 2014 Second Quarter Pulse Surveydemonstrate a healthy financial performance for
vacation ownership. And the industry, according to
Darla Zanini, executive vice president of the
ARDA International Foundation,“continues the upward trend
we saw in our
2014 State of the Vacation Timeshare Industry report released in May. Double-digit increasesin both net-originated timeshare sales volume and total
capital expenditures point to both strong quarterly sales
and reinvestment into the category.”
The survey results reflect the responses from 22
companies, and the financial information contained in the
survey includes the second quarter of 2014 (Q2 2014)
compared to the second quarter of 2013 (Q2 2013).
Timeshare Sales:
Fee-for-Service on the Rise
The total net originated sales for Q2 2014 was US$1.68
billion, an increase of 14.5 percent in sales volume over
Q2 2013. Of further interest, within that aggregate, fee-
for-service arrangements experienced an increase of
31.2 percent, with sales volume growing from US$143
million in Q2 2013 to US$188.85 million in Q2 2014.
“The fee-for-service component of our
industry’s sales numbers is one of the
more exciting recent growth points to
watch, in terms of new revenue to the
mix,” says Howard Nusbaum (inset),
president and CEO of ARDA.
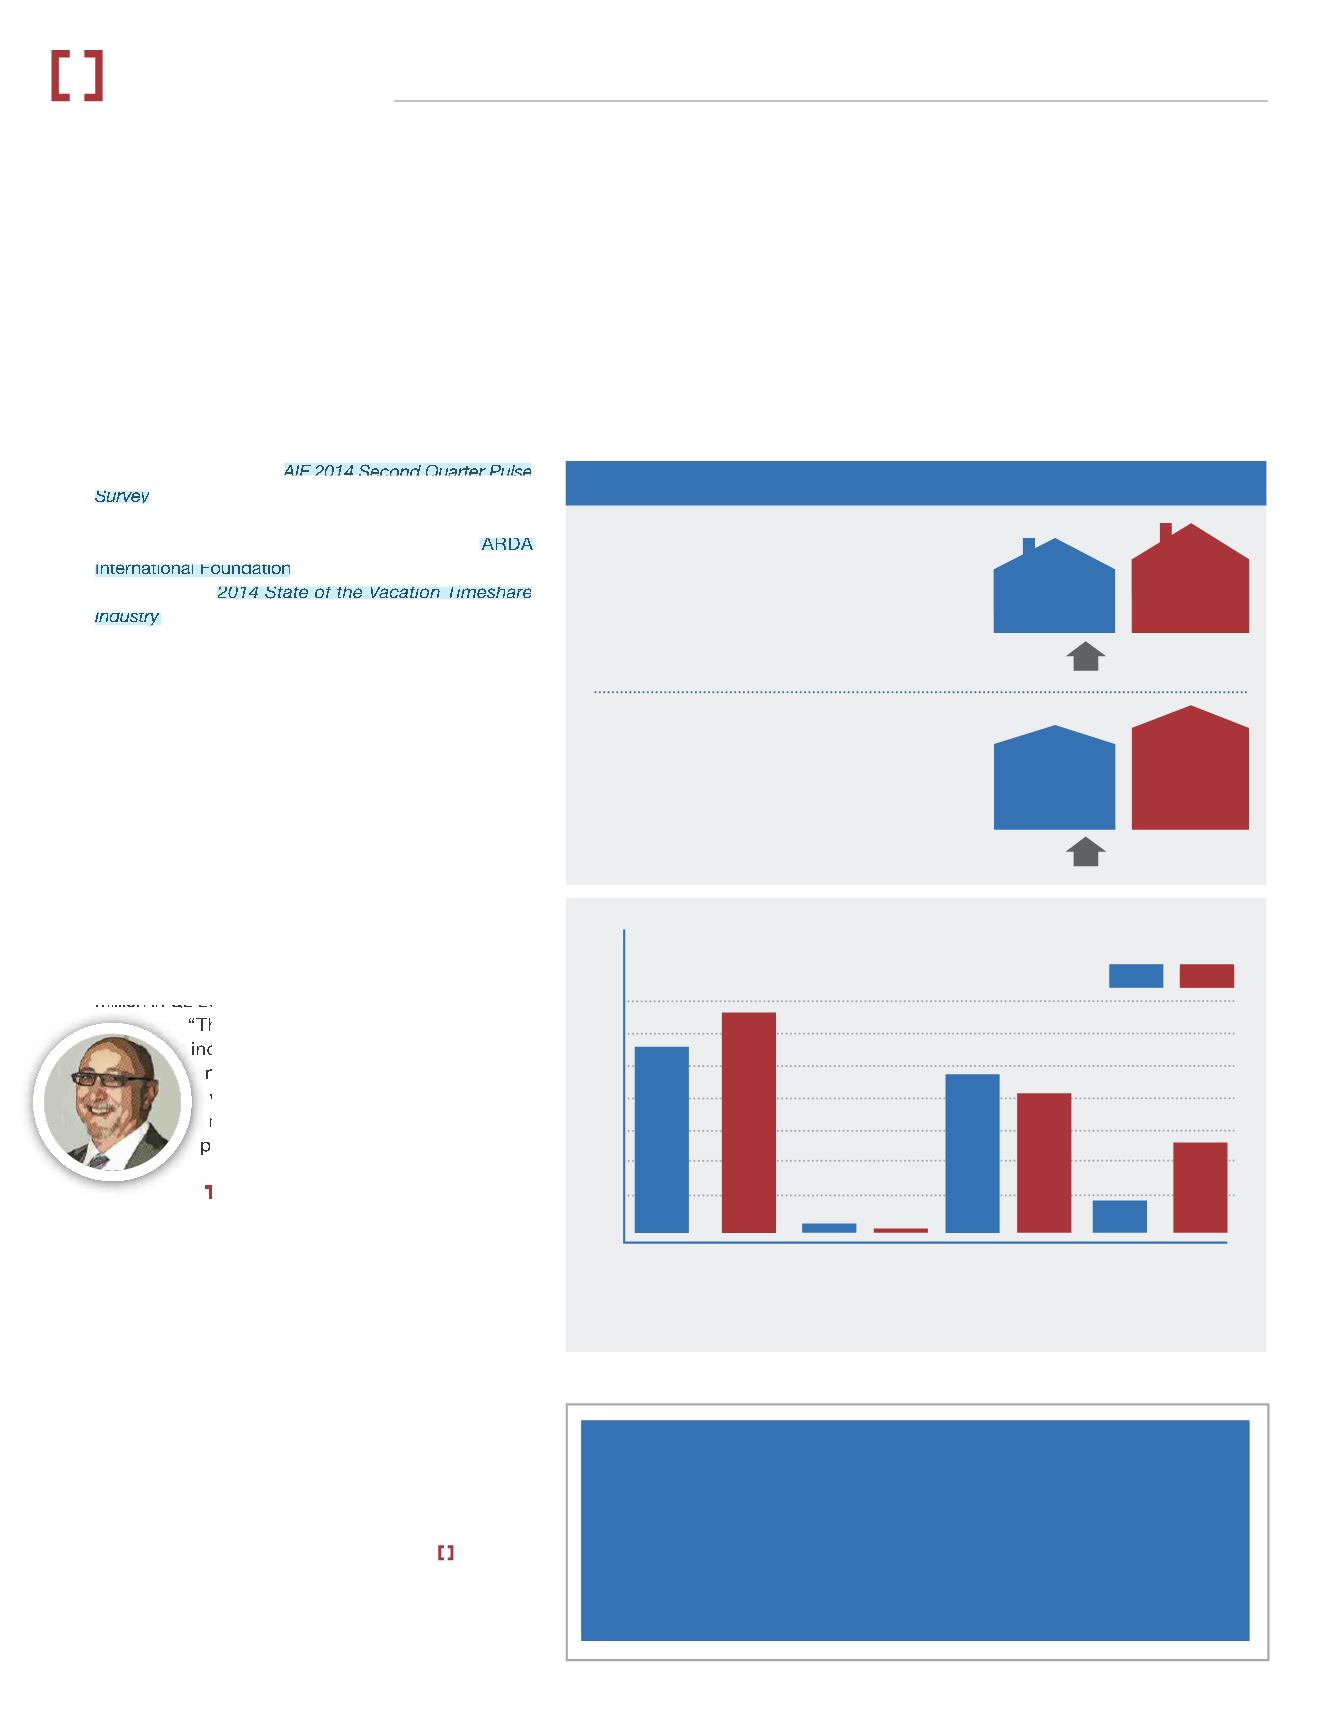
The Downs and Ups
of Capital Expenditures
Survey respondents were asked to provide total
capital expenditures related to new timeshare inventory
projects, completion of existing timeshare inventory
projects, and fully constructed inventory (for example,
turnkey, just-in-time inventory purchases, and buy-
backs from homeowners’ associations).
Capital expenditures on new timeshare inventory
projects and existing timeshare inventory projects
decreased by 43.7 percent (to US$1.88 million) and
12.2 percent (to US$102.18 million), respectively, from
Q2 2013 to Q2 2014. But capital expenditures related
to completed inventory increased by 258.9 percent.
Overall, capital expenditures increased by 22.1
percent in Q2 2014 compared to Q2 2013.
See page 2 for currency conversions.
8
IN
BRIEF
RESORTDEVELOPER.COM
vacation industry review
JANUARY – MARCH 2015
About the
Pulse Survey
In response to the impact of the frozen
credit market on the timeshare industry, in
October 2008, AIF conducted its first quar-
terly financial performance pulse survey,
providing the industry with critical, current
information to use in discussions with
U.S. congressional representatives, the
Department of the Treasury, and members
of the Federal Reserve. Because of its suc-
cess, the ARDA board of directors asked the
AIF to continue the collection of key finan-
cial metrics on a quarterly basis. Since
2009, Deloitte & Touche has been engaged
to conduct the quarterly surveys.
Total Q2
2013 Capital
Expenditures
Total Q2
2014 Capital
Expenditures
Q2 2013
New
Inventory
Q2 2014
New
Inventory
Q2 2013
Existing
Inventory
Q2 2014
Existing
Inventory
Q2 2013
Completed
Inventory
Q2 2014
Completed
Inventory
225
200
175
150
125
100
75
50
25
A Strong Pulse
US$3.34
US$1.88
US$17.78
AIF Quarterly Survey Reports Upswing
in Sales,Capital Expenditures
2013
2014
KEY PERFORMANCE INDICATORS
Net originated timeshare sales (including
telesales and fee-for-service)
increased
14.5
percent from Q2 2013.
Sales Performance:
14.5%
22.1%
Capital expenditures
increased
22.1
percent
from Q2 2013.
Other Metrics:
Capital Expenditures
(In Millions)
Source: Deloitte & Touche, based on 17 company survey responses.
Q2 2013
US$1.467 billion
Q2 2014
US$1.680 billion
$
$
Q2 2013
US$137.53 million
Q2 2014
US$167.86 million
US$137.53
US$167.86
US$116.41
US$102.18
US$63.80