


 97 / 352

THE TRAVEL DEMAND INDEX
makes it easy to plan the best times to travel. For example, if you want to visit Branson, the best prices and availability will
be during weeks 1 through 7. During weeks 23 through 29, you can expect prices to be higher than average and availabilities to be more limited.
ILLINOIS
www.enjoyillinois.comINDIANA
www.enjoyindiana.comIOWA
www.traveliowa.comMICHIGAN
www.michigan.orgMINNESOTA
www.exploreminnesota.comMISSOURI
www.visitmo.comOHIO
www.discoverohio.comWISCONSIN
www.travelwisconsin.comEach resort listing includes the applicable Travel Demand Index chart number.
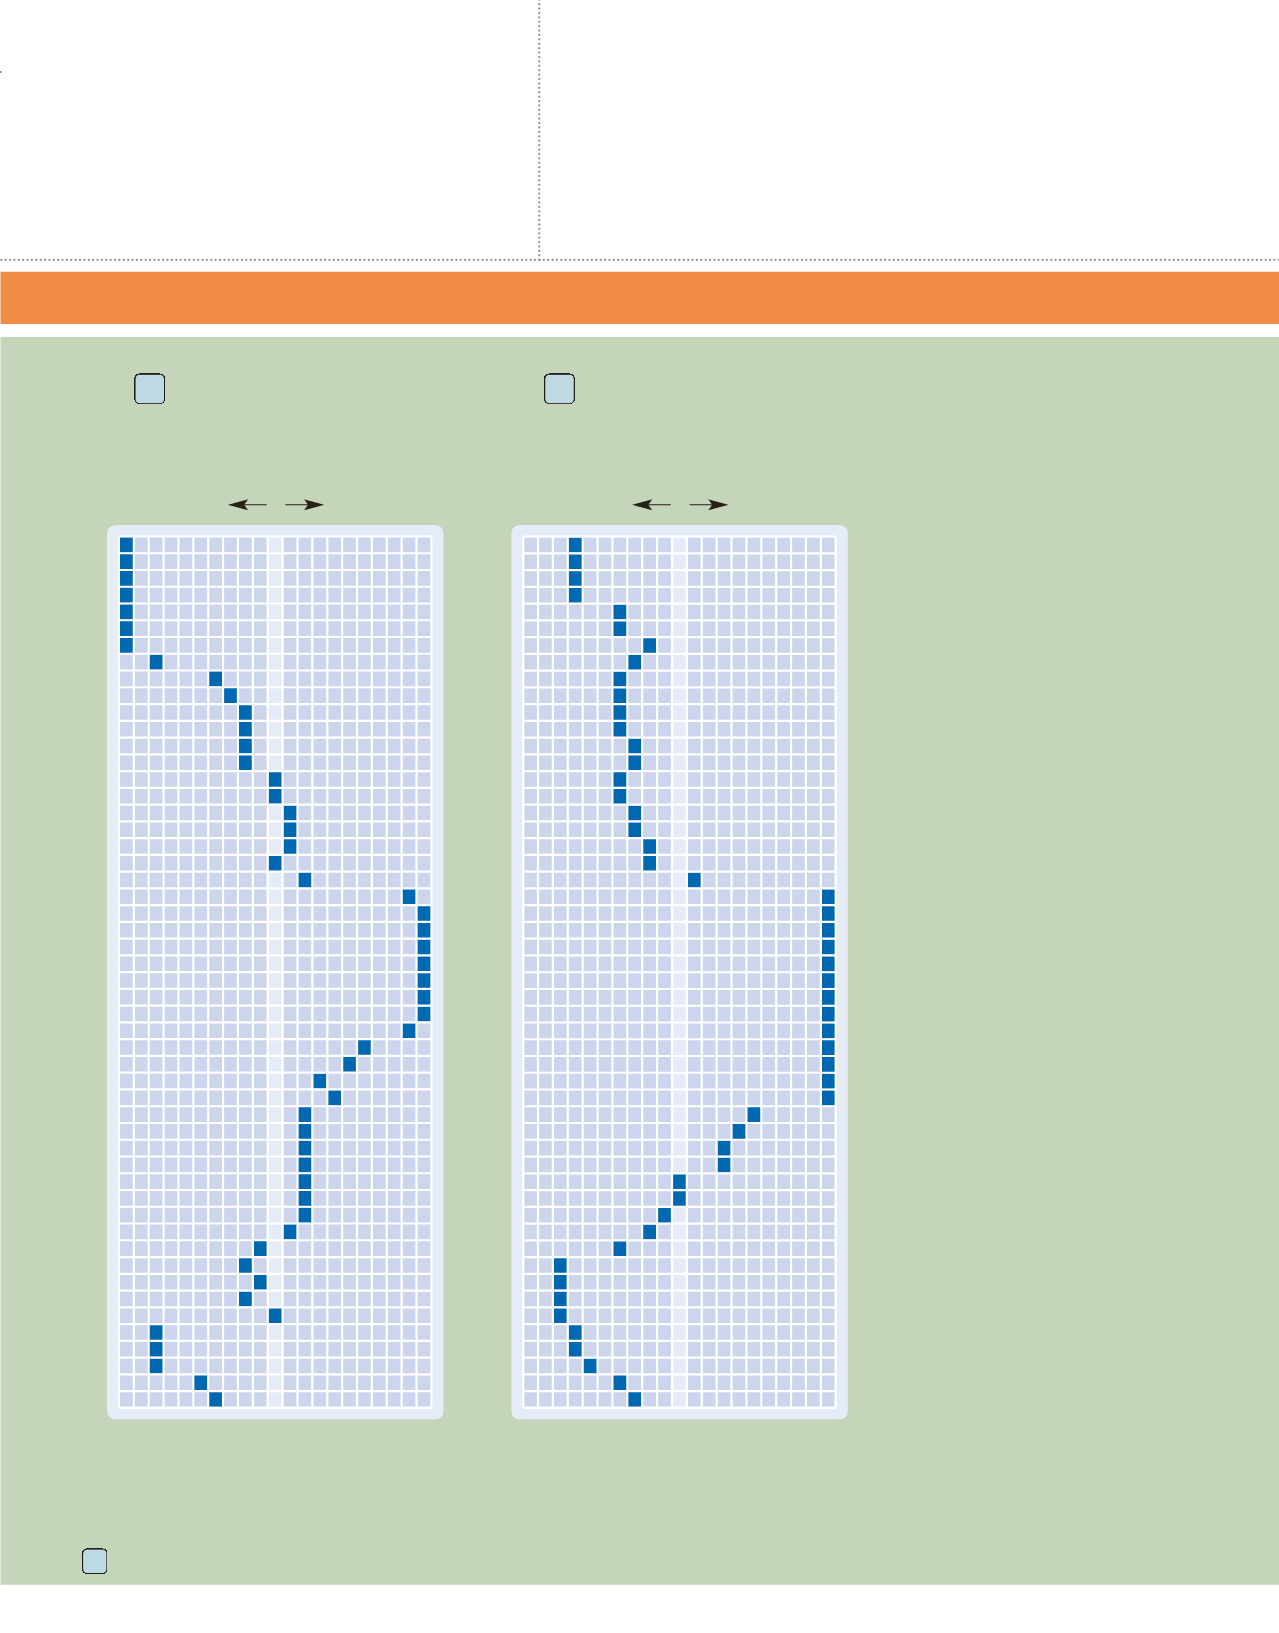
TRAVEL DEMAND INDEX
Midwest, Other Areas
Branson/Lake of the Ozarks/
Hot Springs/Oklahoma
7
31
Market Average
Greatest
Availability
Greatest
Demand
1
2
3
4
5
6
7
8
9
10
11
12
13
14
15
16
17
18
19
20
21
22
23
24
25
26
27
28
29
30
31
32
33
34
35
36
37
38
39
40
41
42
43
44
45
46
47
48
49
50
51
52
50
100
150
Market Average
Greatest
Availability
Greatest
Demand
1
2
3
4
5
6
7
8
9
10
11
12
13
14
15
16
17
18
19
20
21
22
23
24
25
26
27
28
29
30
31
32
33
34
35
36
37
38
39
40
41
42
43
44
45
46
47
48
49
50
51
52
50
100
150
WEEKS