


 77 / 352

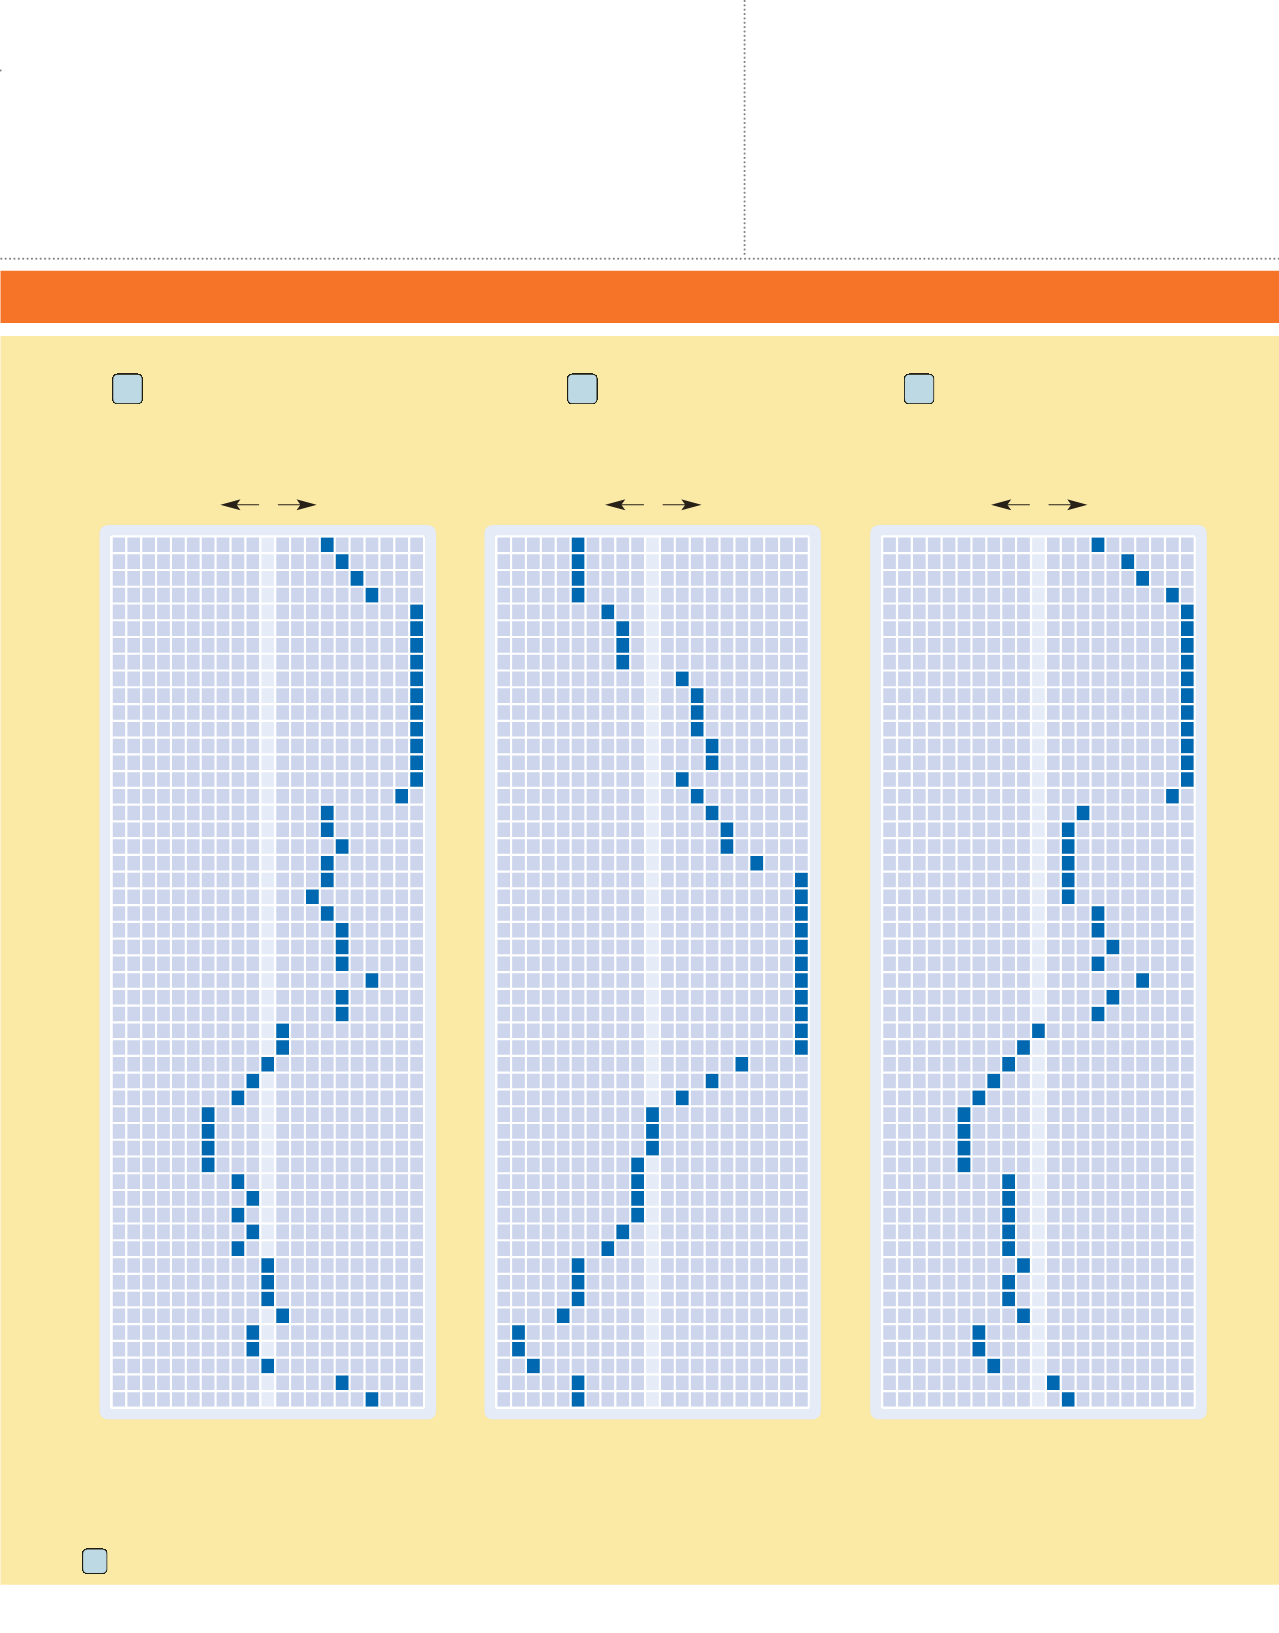
THE TRAVEL DEMAND INDEX
makes it easy to plan the best times to travel. For example, if you want to visit Florida's northern coast, the best prices and
availability will be during weeks 48 and 49. During weeks 9 and 23 through 29, you can expect prices to be higher than average and availabilities to be
more limited.
FLORIDA
www.visitflorida.comEach resort listing includes the applicable Travel Demand Index chart number.
TRAVEL DEMAND INDEX
Lower Keys and Key West
51
Gulf Coast
82
Southwestern Coasts
95
Market Average
Greatest
Availability
Greatest
Demand
1
2
3
4
5
6
7
8
9
10
11
12
13
14
15
16
17
18
19
20
21
22
23
24
25
26
27
28
29
30
31
32
33
34
35
36
37
38
39
40
41
42
43
44
45
46
47
48
49
50
51
52
50
100
150
Market Average
Greatest
Availability
Greatest
Demand
1
2
3
4
5
6
7
8
9
10
11
12
13
14
15
16
17
18
19
20
21
22
23
24
25
26
27
28
29
30
31
32
33
34
35
36
37
38
39
40
41
42
43
44
45
46
47
48
49
50
51
52
50
100
150
Market Average
Greatest
Availability
Greatest
Demand
1
2
3
4
5
6
7
8
9
10
11
12
13
14
15
16
17
18
19
20
21
22
23
24
25
26
27
28
29
30
31
32
33
34
35
36
37
38
39
40
41
42
43
44
45
46
47
48
49
50
51
52
50
100
150