


 67 / 352

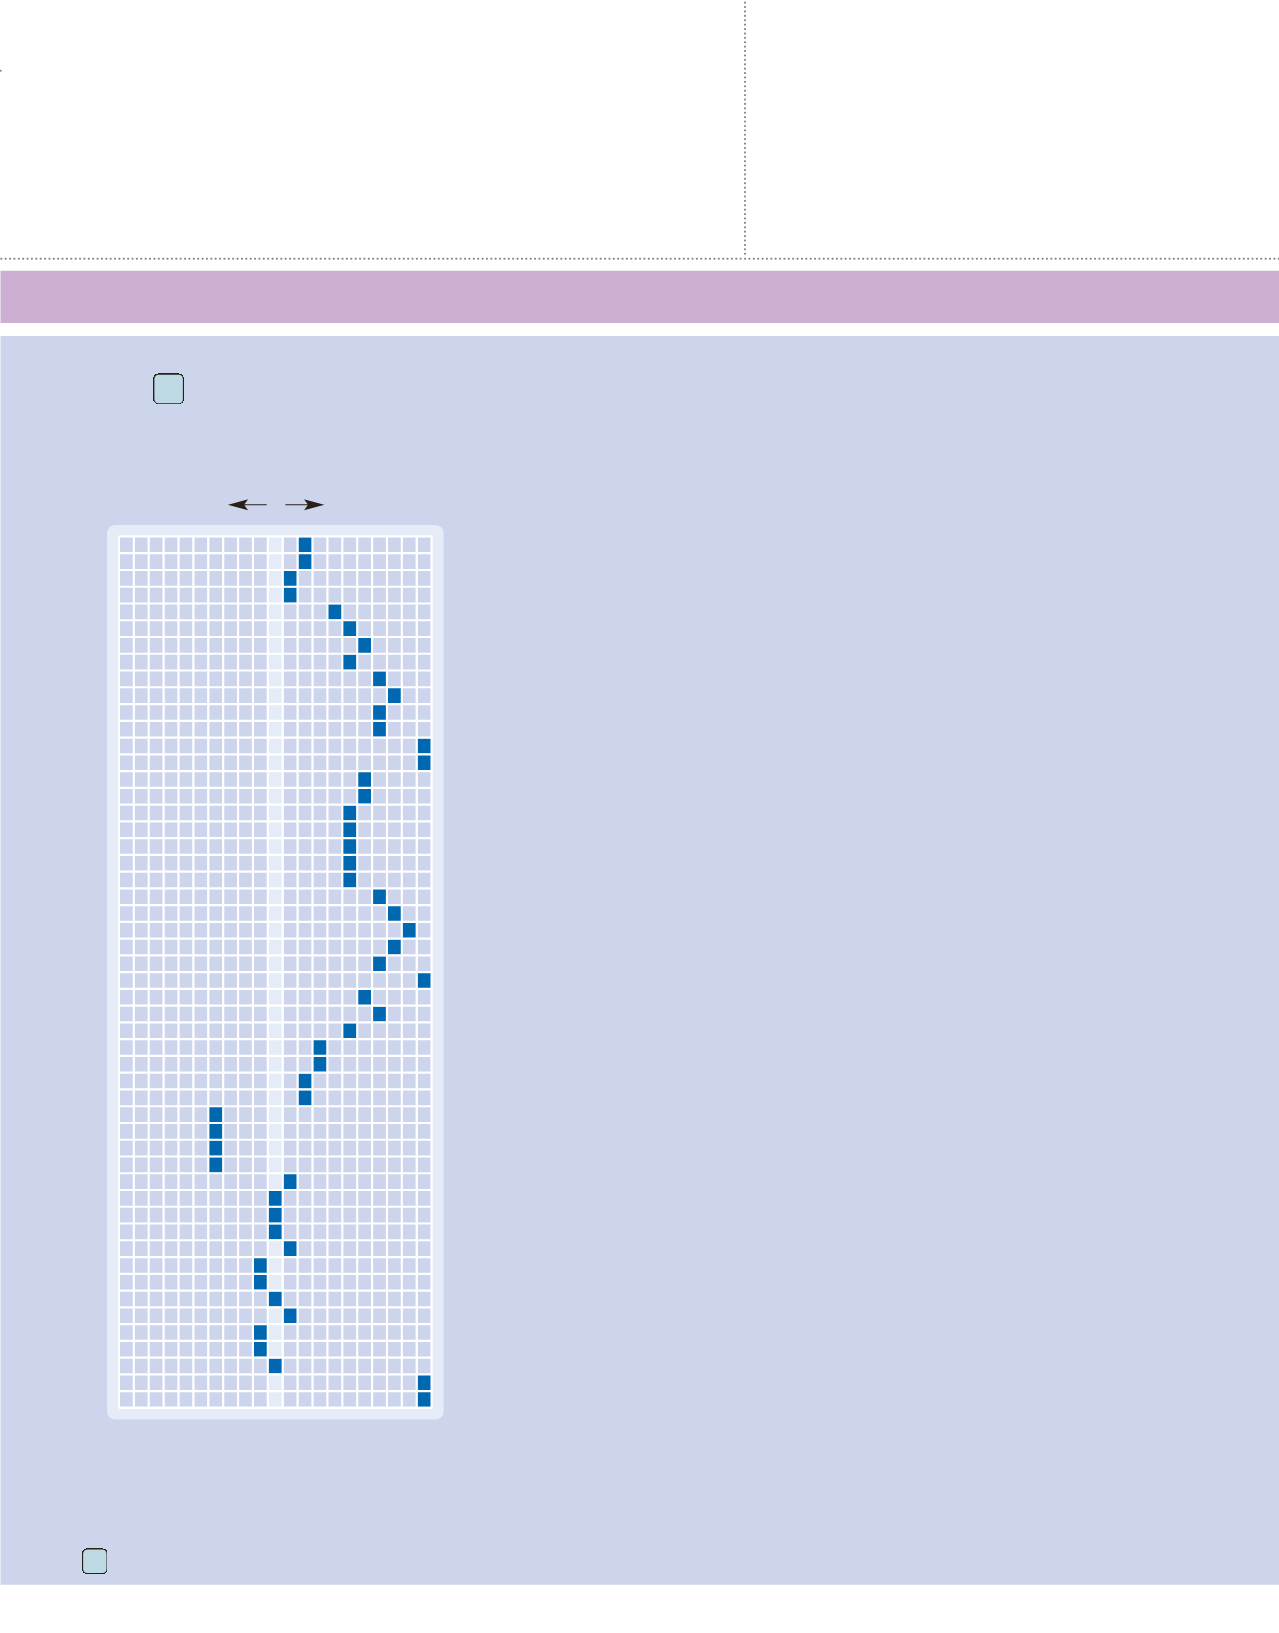
THE TRAVEL DEMAND INDEX
makes it easy to plan the best times to travel. For example, if you want to visit Orlando, the best prices and availability will
be during weeks 35 through 38. During weeks 13, 14, 27, 51, and 52, you can expect prices to be higher than average and availabilities to be more limited.
CENTRAL FLORIDA
www.visitflorida.com www.visitcentralflorida.org www.visitorlando.comOrlando and
Other Inland Areas
5
Market Average
Greatest
Availability
Greatest
Demand
1
2
3
4
5
6
7
8
9
10
11
12
13
14
15
16
17
18
19
20
21
22
23
24
25
26
27
28
29
30
31
32
33
34
35
36
37
38
39
40
41
42
43
44
45
46
47
48
49
50
51
52
50
100
150
WEEKS
Each resort listing includes the applicable Travel Demand Index chart number.
TRAVEL DEMAND INDEX