


 41 / 352

MARYLAND
www.visitmaryland.orgNEW JERSEY
www.visitnj.orgNEW YORK
www.iloveny.comPENNSYLVANIA
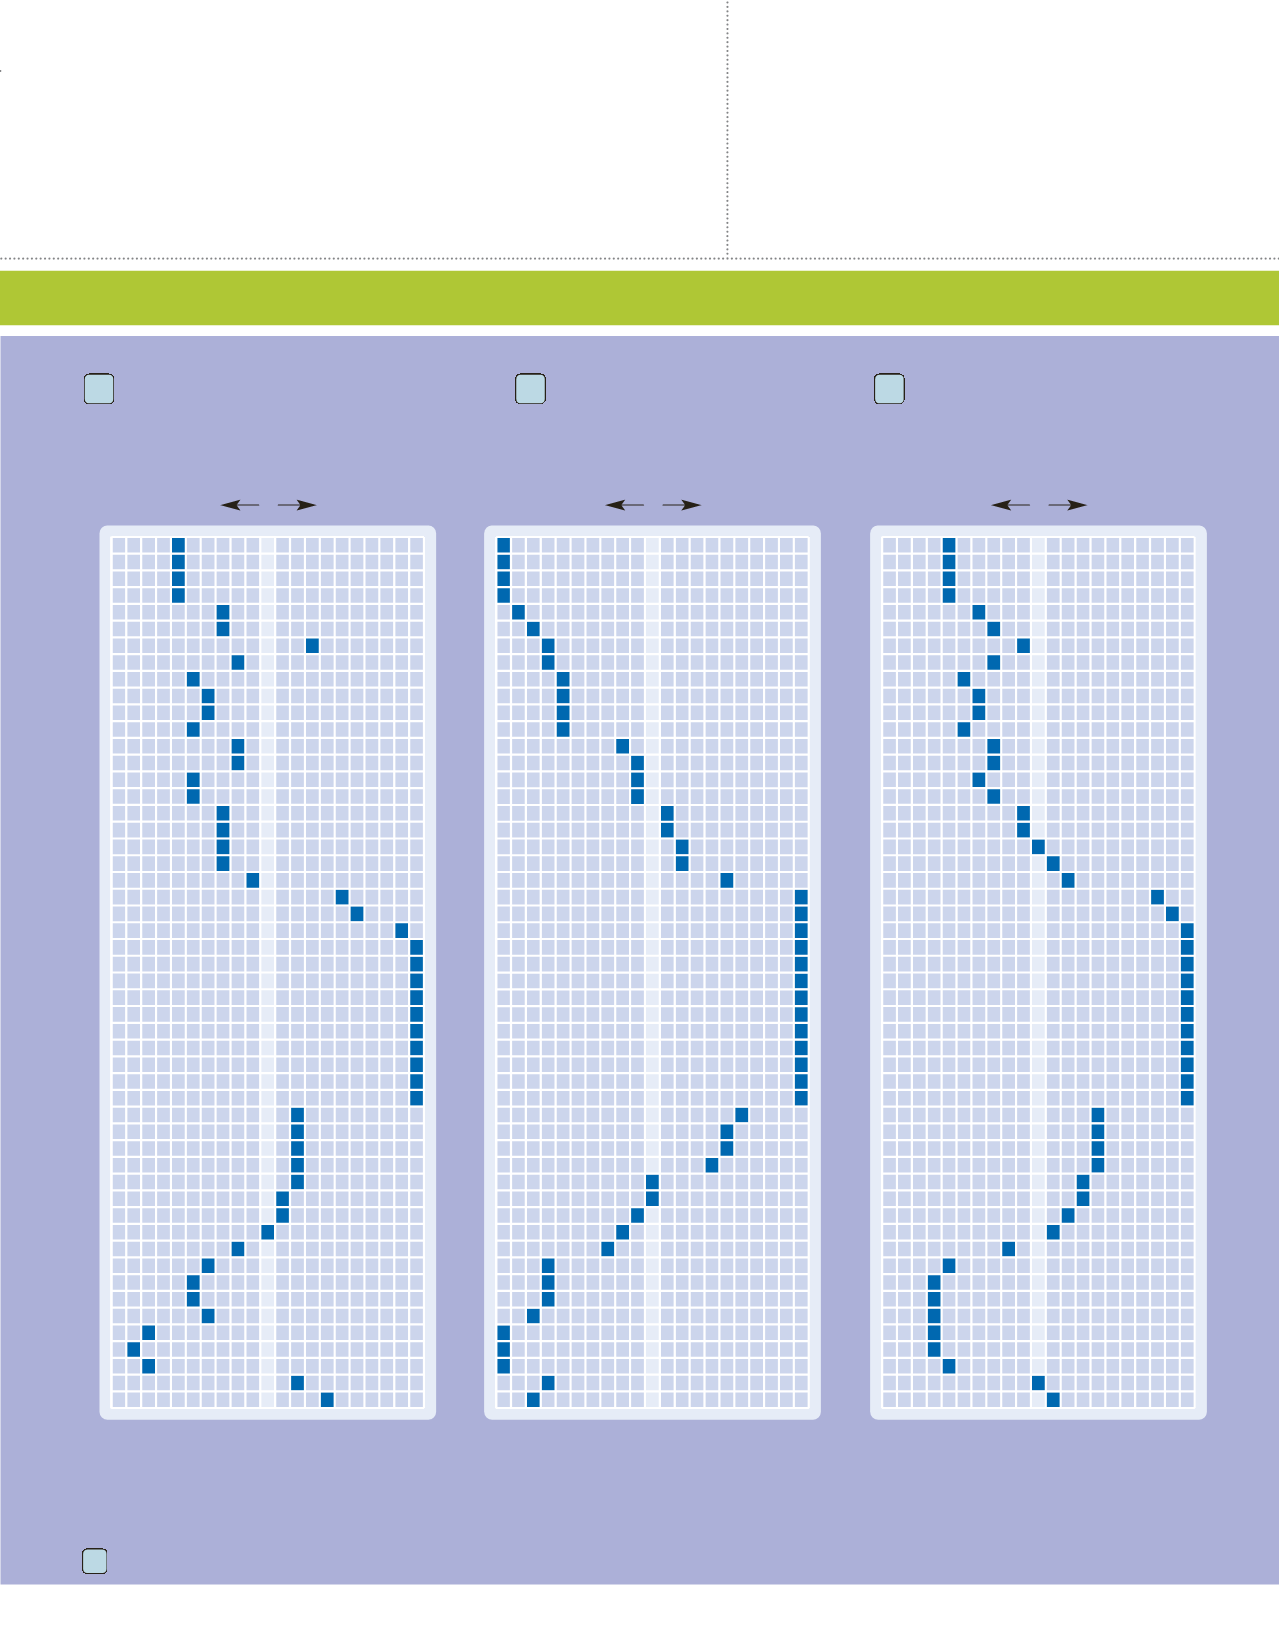
www.visitpa.comTHE TRAVEL DEMAND INDEX
makes it easy to plan the best times to travel. For example, if you want to visit the Middle Atlantic coast, the best prices
and availability will be during weeks 1 through 4 and 48 through 50. During weeks 22 through 34, you can expect prices to be higher than average and
availabilities to be more limited.
Each resort listing includes the applicable Travel Demand Index chart number.
TRAVEL DEMAND INDEX
Middle Atlantic, Coast
Middle Atlantic, Other Areas
Catskills and Pocono Mountains
28
49
67
Market Average
Greatest
Availability
Greatest
Demand
1
2
3
4
5
6
7
8
9
10
11
12
13
14
15
16
17
18
19
20
21
22
23
24
25
26
27
28
29
30
31
32
33
34
35
36
37
38
39
40
41
42
43
44
45
46
47
48
49
50
51
52
50
100
150
Market Average
Greatest
Availability
Greatest
Demand
1
2
3
4
5
6
7
8
9
10
11
12
13
14
15
16
17
18
19
20
21
22
23
24
25
26
27
28
29
30
31
32
33
34
35
36
37
38
39
40
41
42
43
44
45
46
47
48
49
50
51
52
50
100
150
Market Average
Greatest
Availability
Greatest
Demand
1
2
3
4
5
6
7
8
9
10
11
12
13
14
15
16
17
18
19
20
21
22
23
24
25
26
27
28
29
30
31
32
33
34
35
36
37
38
39
40
41
42
43
44
45
46
47
48
49
50
51
52
50
100
150