


 315 / 352

BANGLADESH
www.tourismboard.gov.bdCHINA
www.cnto.orgINDIA
www.incredibleindia.orgINDONESIA
www.indonesia.travelJAPAN
www.jnto.go.jpKOREA
www.visitkorea.or.krMALAYSIA
www.tourism.gov.myNEPAL
www.welcomenepal.comPHILIPPINES
SINGAPORE
www.yoursingapore.comTHAILAND
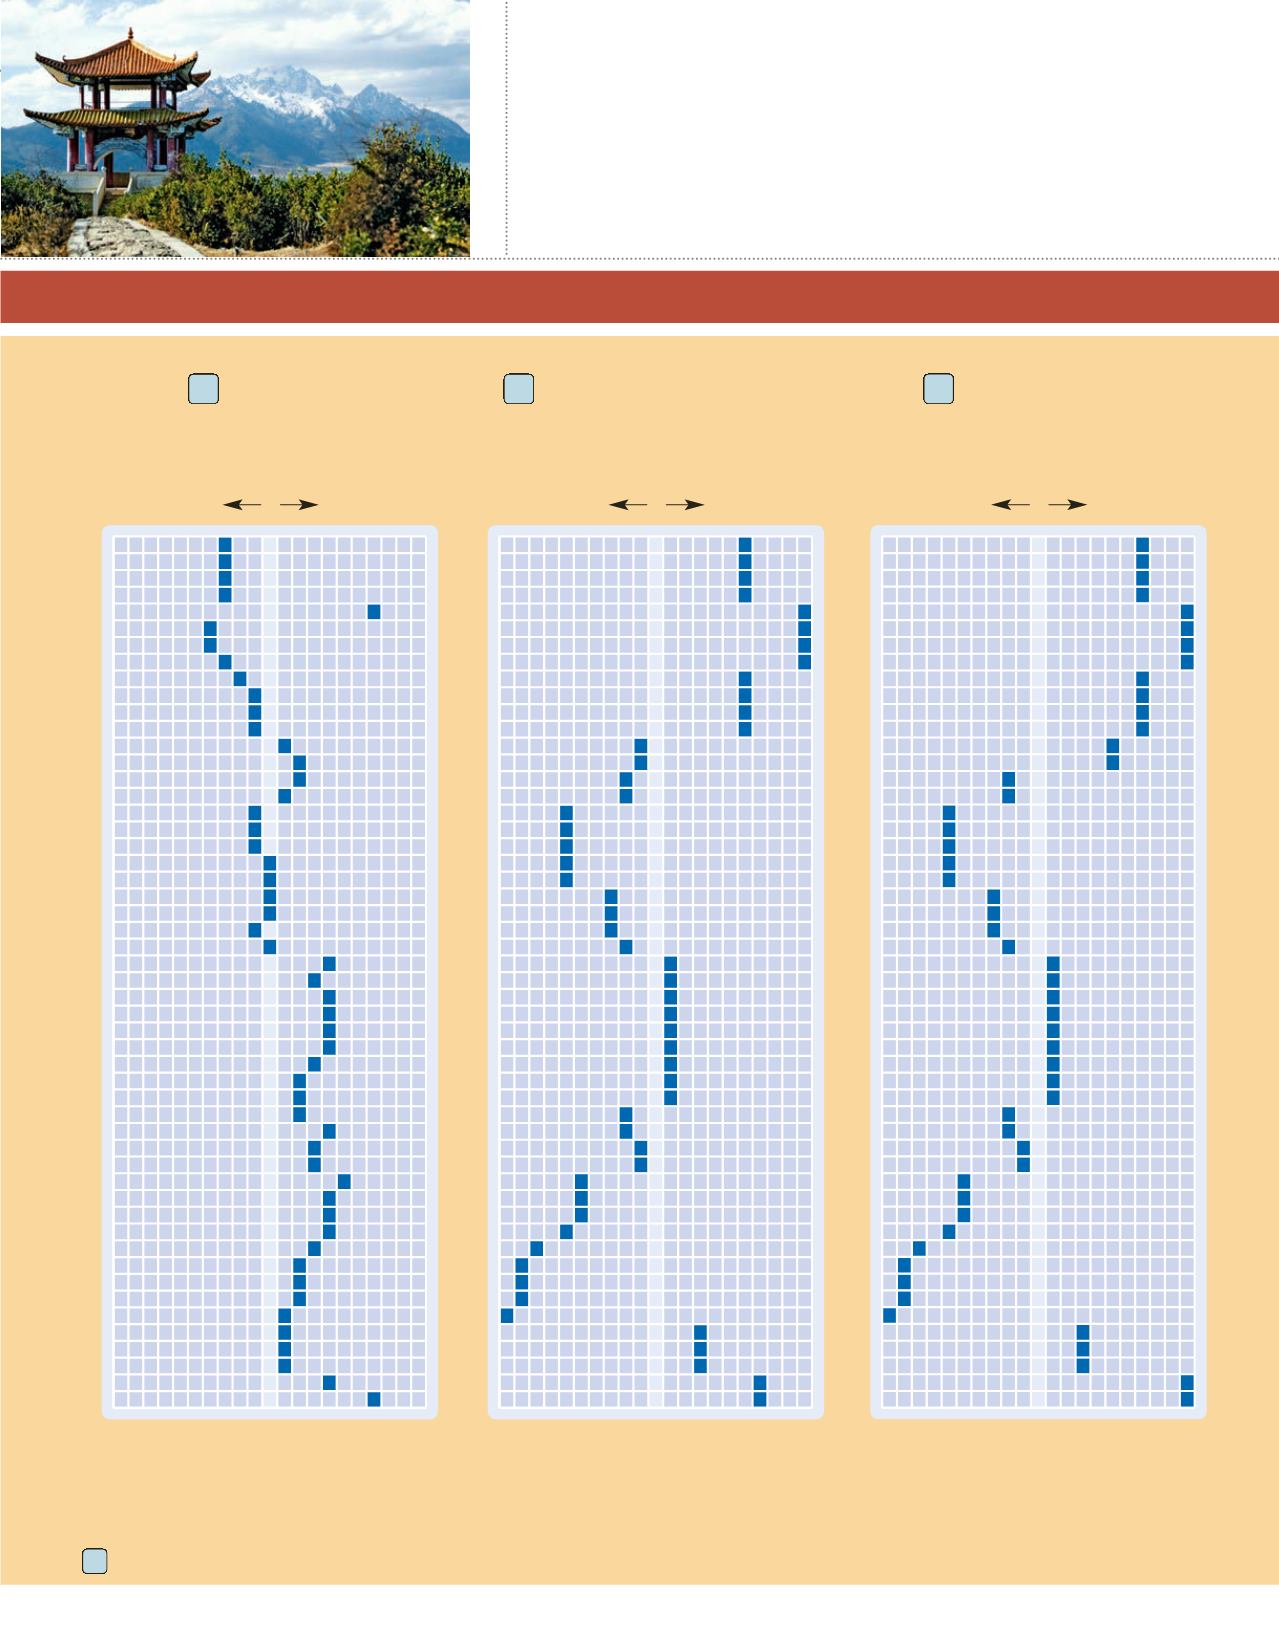
www.tourismthailand.orgTHE TRAVEL DEMAND INDEX
makes it easy to plan the best times to travel. For example, if you want to visit East Asia, the best prices and availability will
be during weeks 6 and 7. During weeks 5 and 52, you can expect prices to be higher than average and availabilities to be more limited.
Each resort listing includes the applicable Travel Demand Index chart number.
TRAVEL DEMAND INDEX
www.itsmorefuninthephilippines.comNortheast Asia, Ski Areas
105
East Asia
26
Market Average
Market Average
Greatest
Availability
Greatest
Availability
Greatest
Demand
Greatest
Demand
1
2
3
4
5
6
7
8
9
10
11
12
13
14
15
16
17
18
19
20
21
22
23
24
25
26
27
28
29
30
31
32
33
34
35
36
37
38
39
40
41
42
43
44
45
46
47
48
49
50
51
52
1
2
3
4
5
6
7
8
9
10
11
12
13
14
15
16
17
18
19
20
21
22
23
24
25
26
27
28
29
30
31
32
33
34
35
36
37
38
39
40
41
42
43
44
45
46
47
48
49
50
51
52
50
100
150
50
100
150
Japan, Ski Areas
109
Market Average
Greatest
Availability
Greatest
Demand
1
2
3
4
5
6
7
8
9
10
11
12
13
14
15
16
17
18
19
20
21
22
23
24
25
26
27
28
29
30
31
32
33
34
35
36
37
38
39
40
41
42
43
44
45
46
47
48
49
50
51
52
50
100
150