


 31 / 352

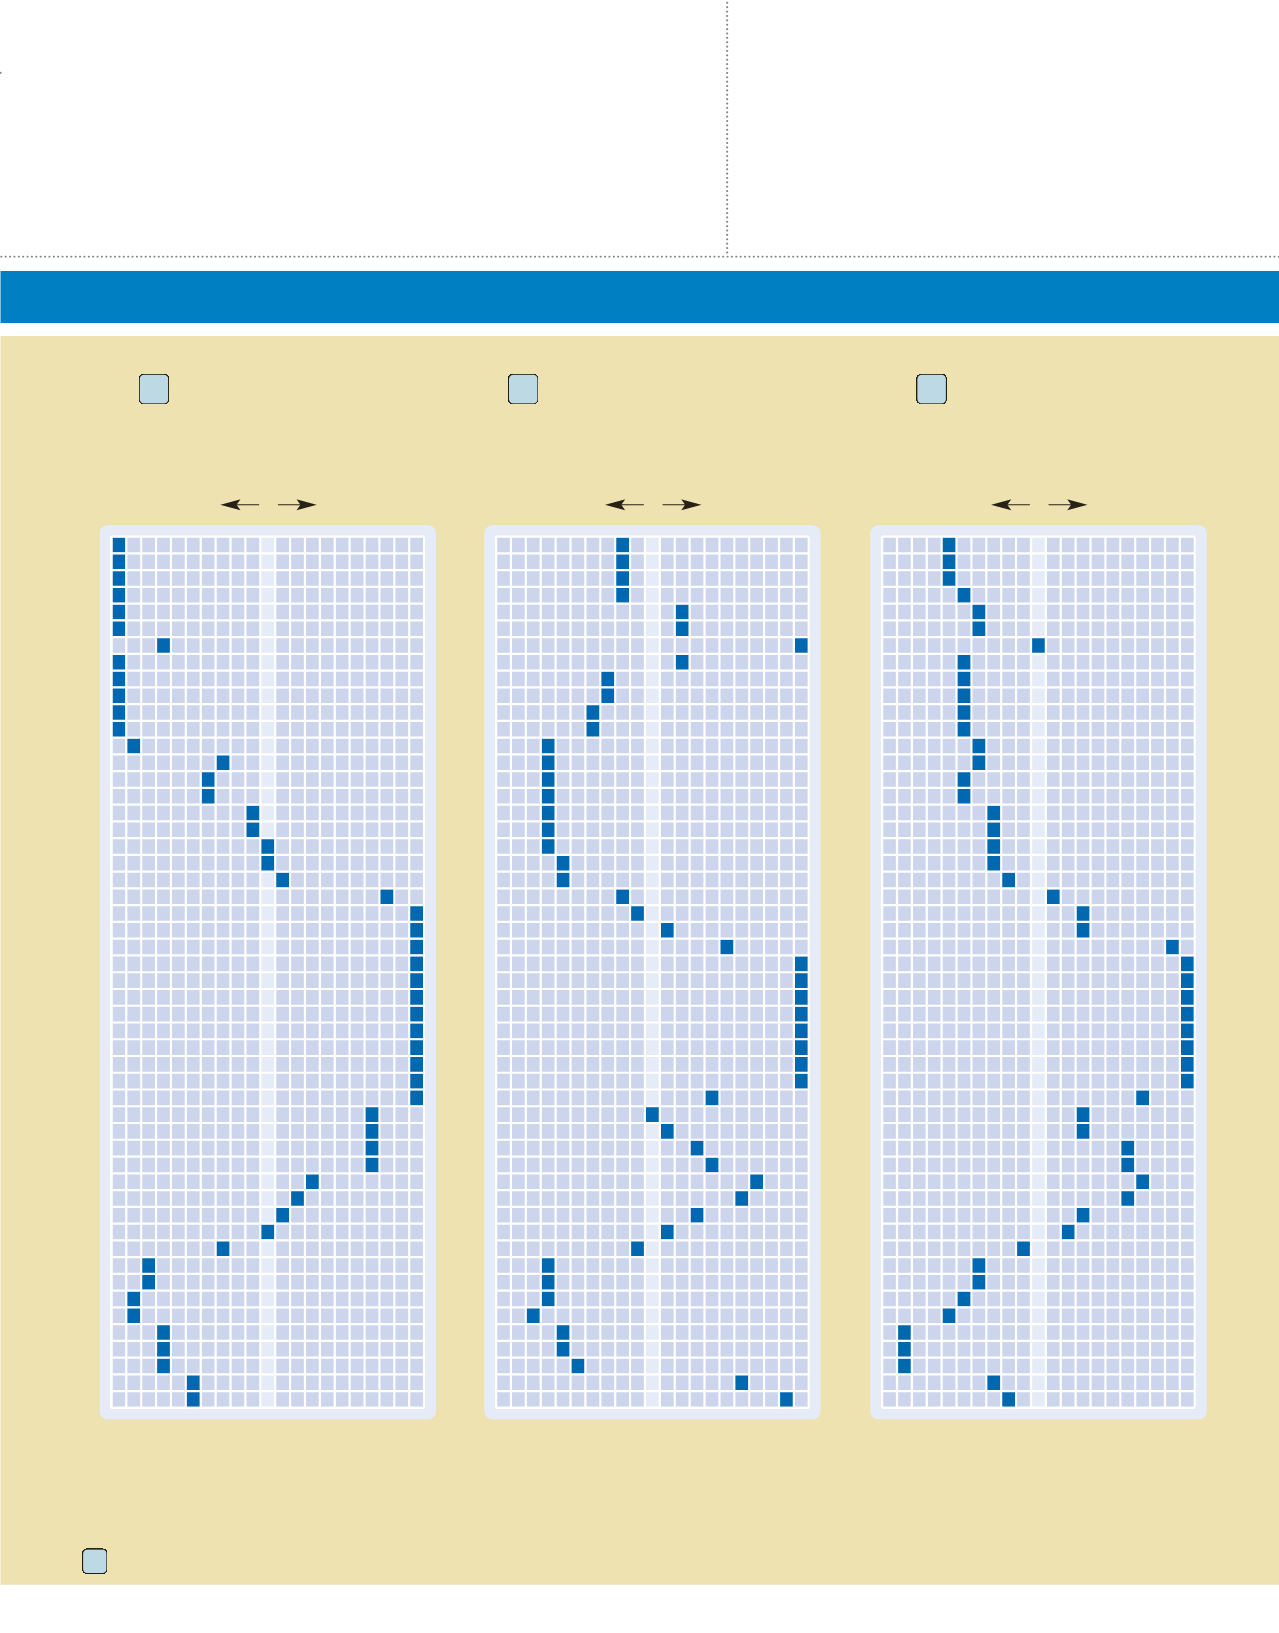
THE TRAVEL DEMAND INDEX
makes it easy to plan the best times to travel. For example, if you want to visit a New England ski area, the best prices and
availability will be during week 47. During weeks 7 and 26 through 33, you can expect prices to be higher than average and availabilities to be more limited.
CONNECTICUT
www.ctvisit.comMAINE
www.visitmaine.comMASSACHUSETTS
www.massvacation.comNEW HAMPSHIRE
www.visitnh.govRHODE ISLAND
www.visitrhodeisland.comVERMONT
www.vermontvacation.comEach resort listing includes the applicable Travel Demand Index chart number.
TRAVEL DEMAND INDEX
New England, Ski Areas
New England,
Other Inland Areas
New England, Coast
27
48
66
Market Average
Greatest
Availability
Greatest
Demand
1
2
3
4
5
6
7
8
9
10
11
12
13
14
15
16
17
18
19
20
21
22
23
24
25
26
27
28
29
30
31
32
33
34
35
36
37
38
39
40
41
42
43
44
45
46
47
48
49
50
51
52
50
100
150
Market Average
Greatest
Availability
Greatest
Demand
1
2
3
4
5
6
7
8
9
10
11
12
13
14
15
16
17
18
19
20
21
22
23
24
25
26
27
28
29
30
31
32
33
34
35
36
37
38
39
40
41
42
43
44
45
46
47
48
49
50
51
52
50
100
150
Market Average
Greatest
Availability
Greatest
Demand
1
2
3
4
5
6
7
8
9
10
11
12
13
14
15
16
17
18
19
20
21
22
23
24
25
26
27
28
29
30
31
32
33
34
35
36
37
38
39
40
41
42
43
44
45
46
47
48
49
50
51
52
50
100
150