


 301 / 352

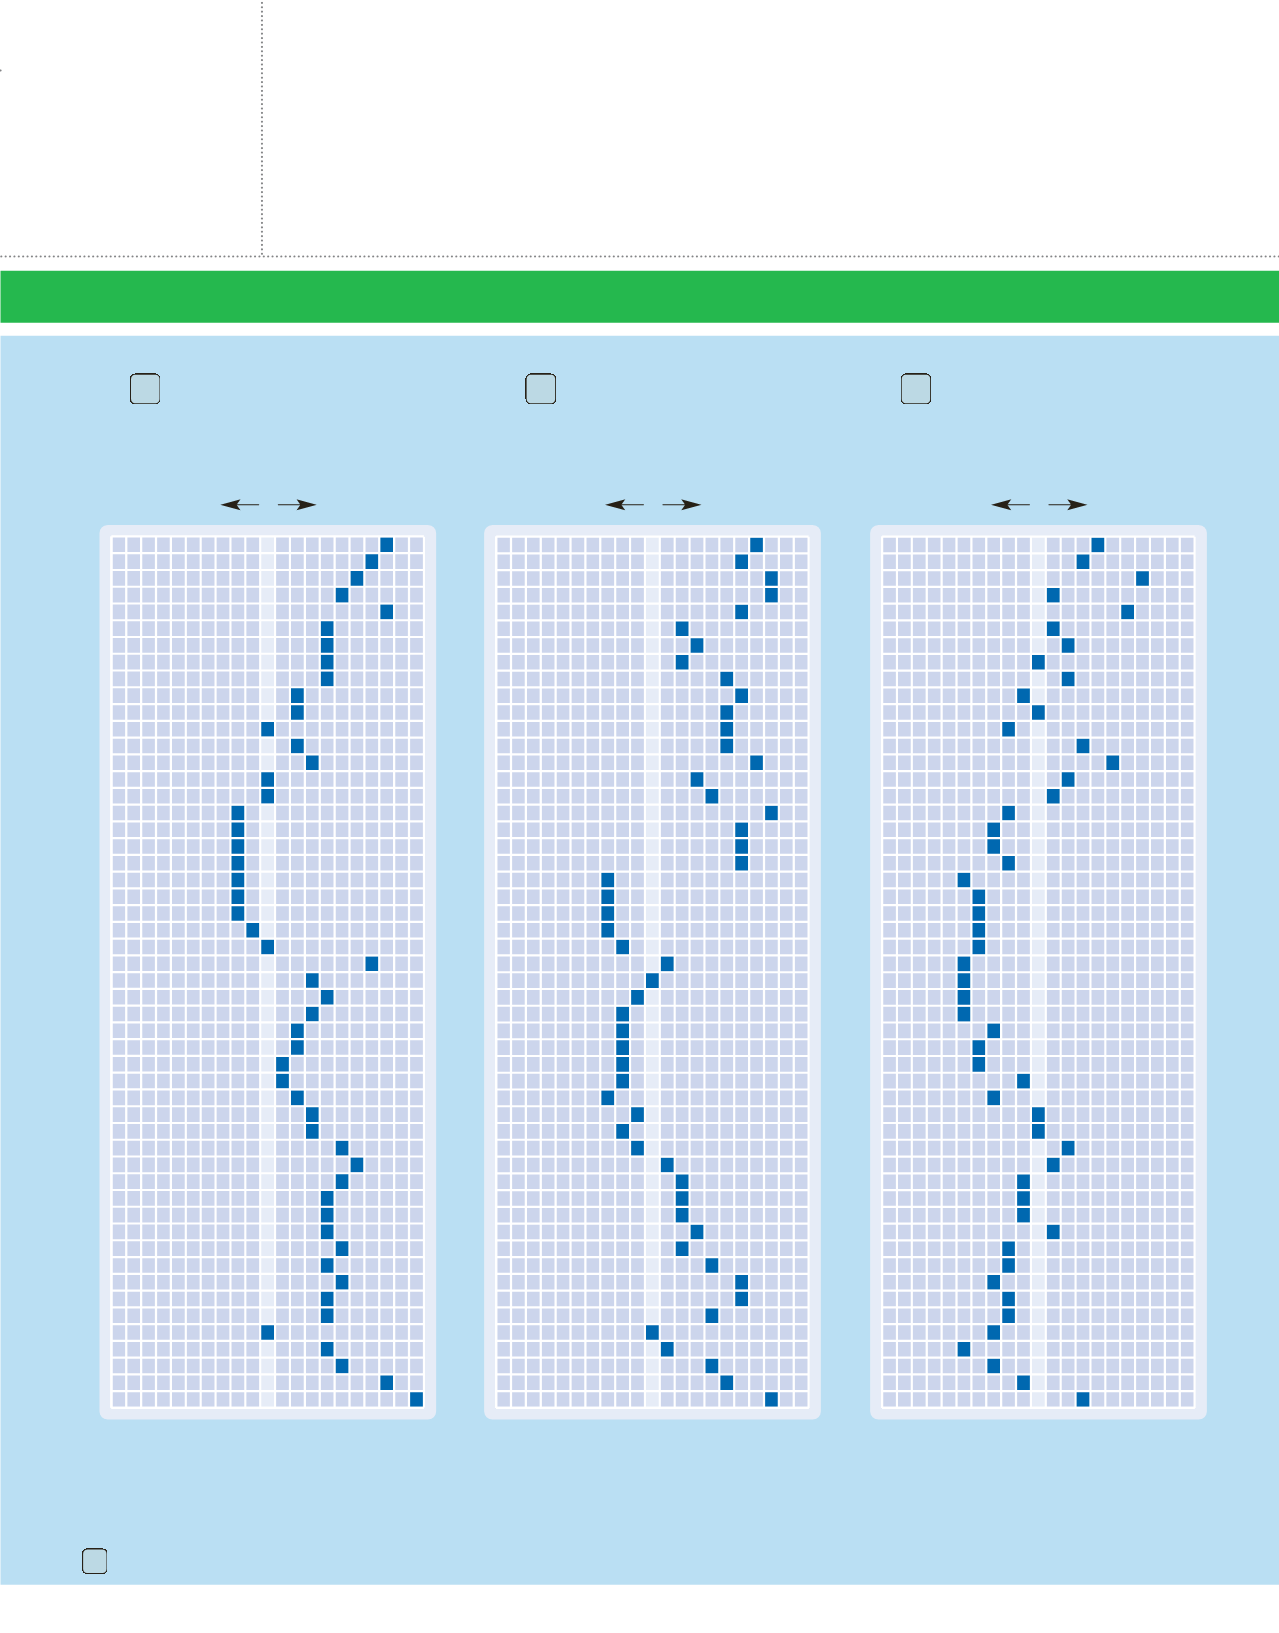
THE TRAVEL DEMAND INDEX
makes it easy to plan the best times to travel. For example, if you want to visit Queensland, Australia, the best prices and
availability will be during weeks 17 through 23. During week 52, you can expect prices to be higher than average and availabilities to be more limited.
AUSTRALIA
www.australia.comNew South Wales
www.visitnsw.com www.tourism.nsw.gov.auQueensland
www.queenslandholidays.com.au www.cairnsgreatbarrierreef.org.auSouth Australia
www.southaustralia.comVictoria
www.visitvictoria.com www.visitmelbourne.comWestern Australia
www.westernaustralia.comFIJI
www.fiji.travelNEW CALEDONIA
www.visitnewcaledonia.comNEW ZEALAND
www.newzealand.comEach resort listing includes the applicable Travel Demand Index chart number.
TRAVEL DEMAND INDEX
Australia, Queensland
46
Australia, Other Areas
75
Australia, Victoria
and South Australia
64
Market Average
Market Average
Market Average
Greatest
Availability
Greatest
Availability
Greatest
Availability
Greatest
Demand
Greatest
Demand
Greatest
Demand
1
2
3
4
5
6
7
8
9
10
11
12
13
14
15
16
17
18
19
20
21
22
23
24
25
26
27
28
29
30
31
32
33
34
35
36
37
38
39
40
41
42
43
44
45
46
47
48
49
50
51
52
1
2
3
4
5
6
7
8
9
10
11
12
13
14
15
16
17
18
19
20
21
22
23
24
25
26
27
28
29
30
31
32
33
34
35
36
37
38
39
40
41
42
43
44
45
46
47
48
49
50
51
52
1
2
3
4
5
6
7
8
9
10
11
12
13
14
15
16
17
18
19
20
21
22
23
24
25
26
27
28
29
30
31
32
33
34
35
36
37
38
39
40
41
42
43
44
45
46
47
48
49
50
51
52
50
100
150
50
100
150
50
100
150