


 289 / 352

EGYPT
www.egypt.travelTHE GAMBIA
www.visitthegambia.gmISRAEL
www.goisrael.comLEBANON
www.destinationlebanon.gov.lbMAURITIUS
www.mauritius.netMOROCCO
www.visitmorocco.comSOUTH AFRICA
www.southafrica.netTUNISIA
www.cometotunisia.co.ukUNITED ARAB EMIRATES
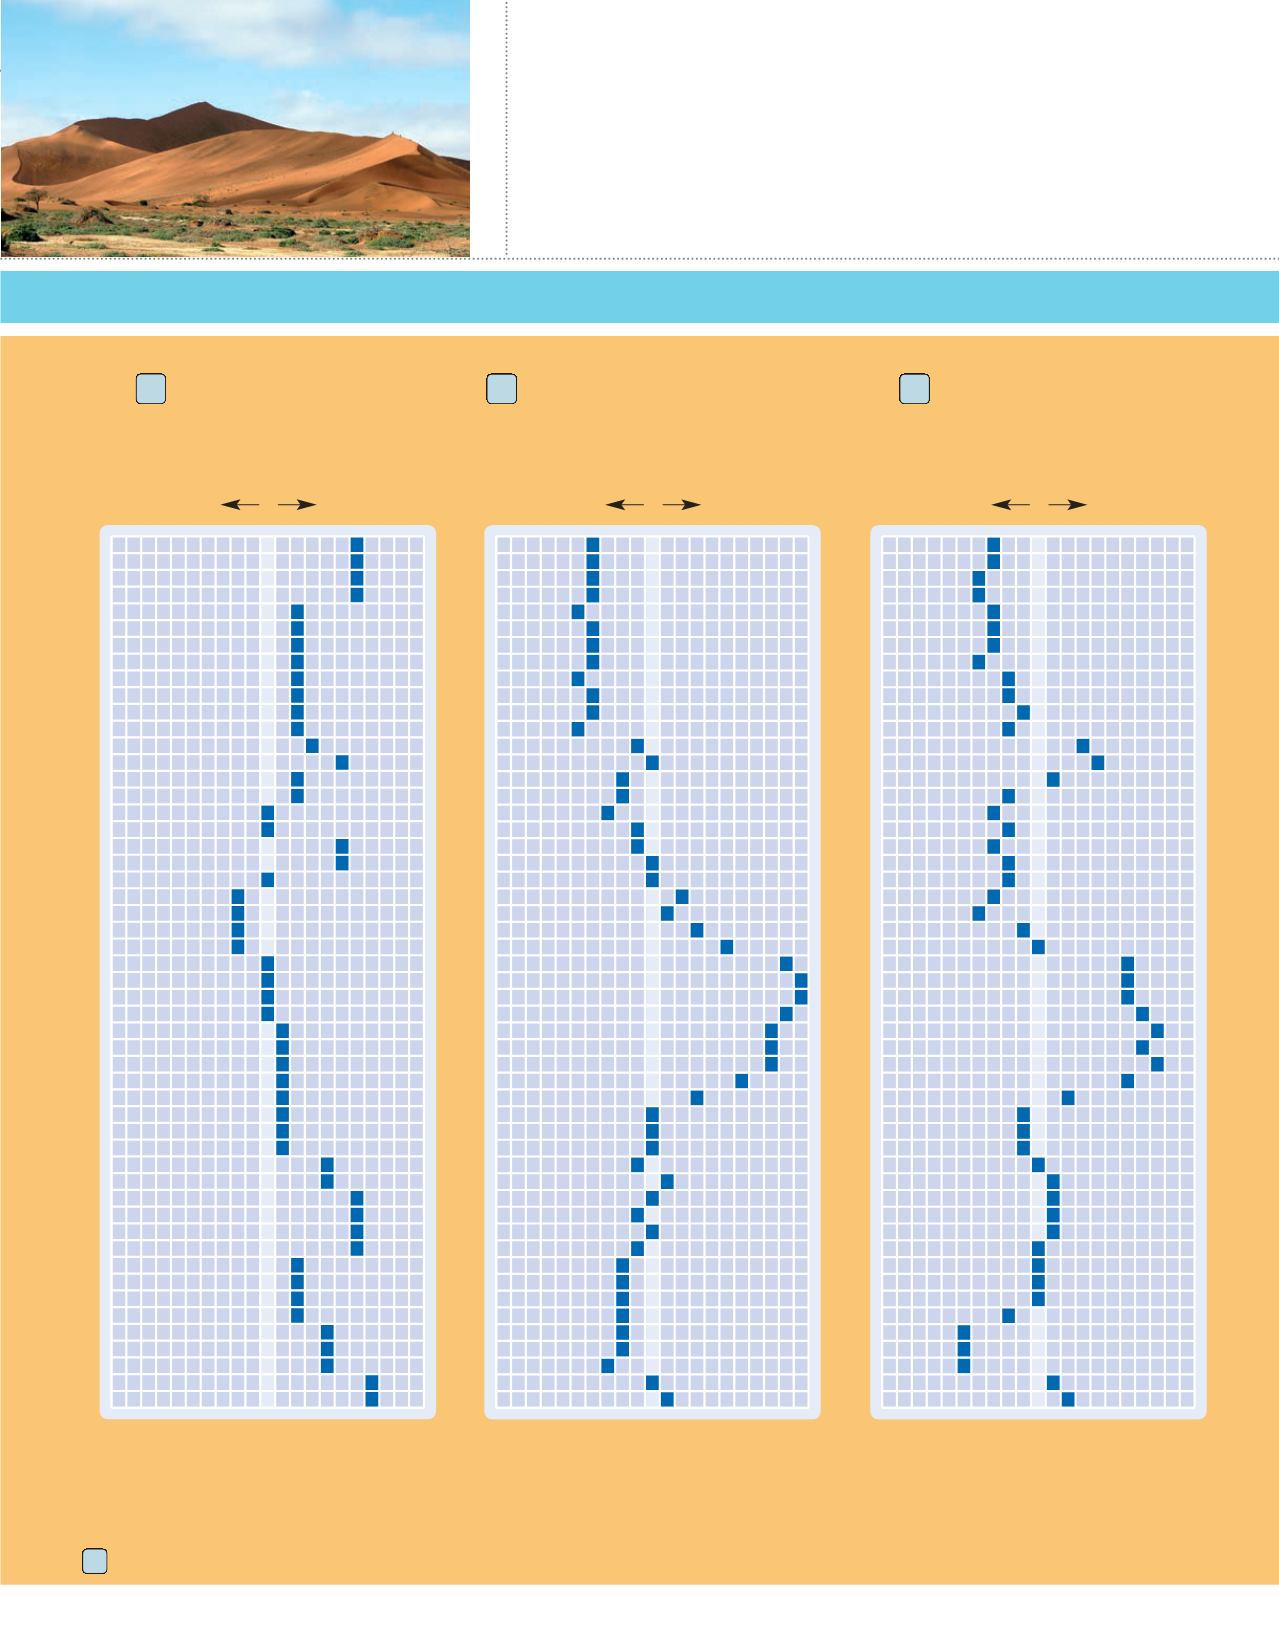
www.definitelydubai.comTHE TRAVEL DEMAND INDEX
makes it easy to plan the best times to travel. For example, if you want to visit the Red Sea coast, the best prices and
availability will be during weeks 48 through 50. During weeks 30 and 32, you can expect prices to be higher than average and availabilities to be more limited.
Each resort listing includes the applicable Travel Demand Index chart number.
TRAVEL DEMAND INDEX
Market Average
Market Average
Greatest
Availability
Greatest
Availability
Greatest
Demand
Greatest
Demand
1
2
3
4
5
6
7
8
9
10
11
12
13
14
15
16
17
18
19
20
21
22
23
24
25
26
27
28
29
30
31
32
33
34
35
36
37
38
39
40
41
42
43
44
45
46
47
48
49
50
51
52
1
2
3
4
5
6
7
8
9
10
11
12
13
14
15
16
17
18
19
20
21
22
23
24
25
26
27
28
29
30
31
32
33
34
35
36
37
38
39
40
41
42
43
44
45
46
47
48
49
50
51
52
50
100
150
50
100
150
Market Average
Greatest
Availability
Greatest
Demand
1
2
3
4
5
6
7
8
9
10
11
12
13
14
15
16
17
18
19
20
21
22
23
24
25
26
27
28
29
30
31
32
33
34
35
36
37
38
39
40
41
42
43
44
45
46
47
48
49
50
51
52
50
100
150
Indian Ocean Islands
108
Middle East &
Africa, Mediterranean Coast
45
Middle East &
Africa, Red Sea Coast
63