


 209 / 352

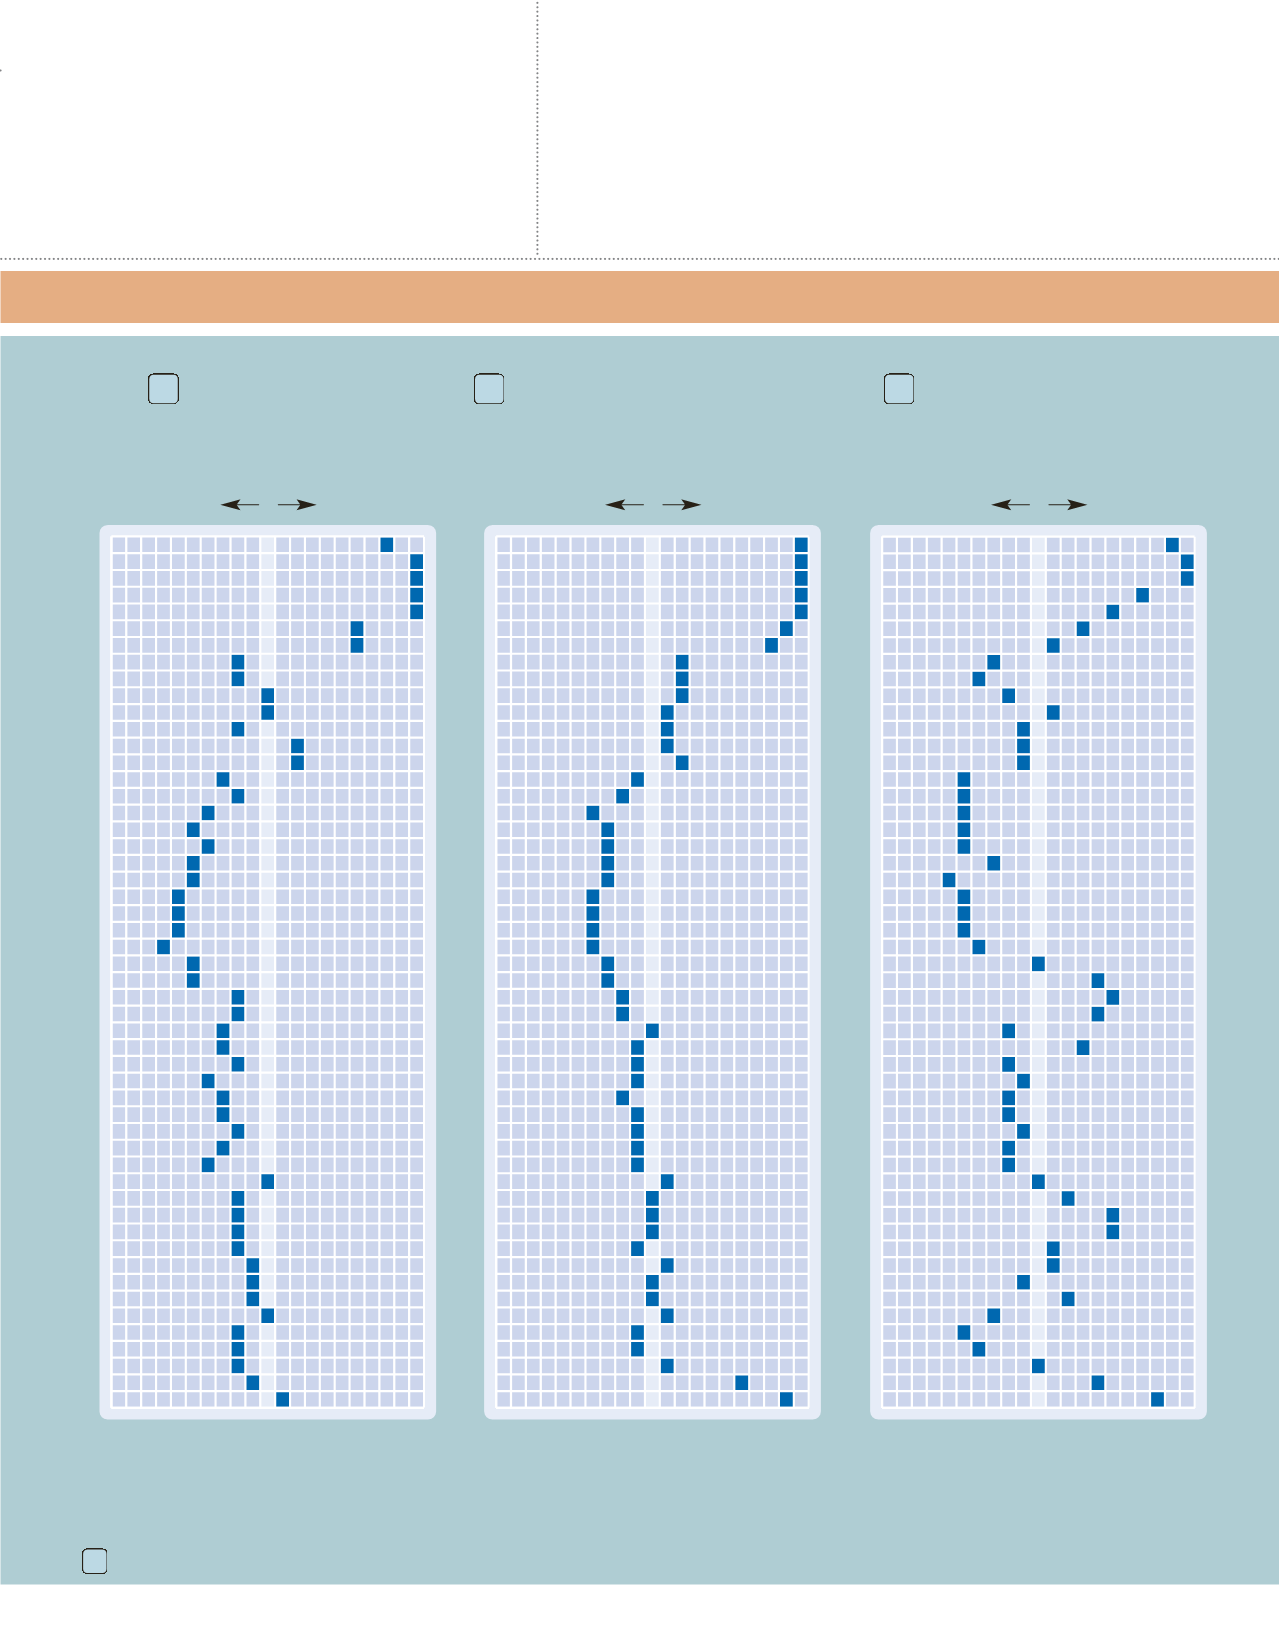
THE TRAVEL DEMAND INDEX
makes it easy to plan the best times to travel. For example, if you want to visit a ski area in Argentina or Chile, the best
prices and availability will be during weeks 19, 41, 45, and 49. During weeks 1 through 3, 5, 6, 28 through 30, 32, 33, and 36, you can expect prices to be
higher than average and availabilities to be more limited.
ARGENTINA
www.turismo.gov.arBOLIVIA
www.bolivia-usa.orgBRAZIL
www.visitbrasil.comCHILE
www.thisischile.cl www.chile.travelCOLOMBIA
www.colombia.travelECUADOR
www.ecuador.travelPERU
www.visitperu.comURUGUAY
www.uruguaynatural.comVENEZUELA
www.venezuelatuya.comEach resort listing includes the applicable Travel Demand Index chart number.
TRAVEL DEMAND INDEX
Brazil, Northeastern Coast
and Other Northern Areas
103
Brazil, Southeastern Coast
and Argentina/Uruguay, Coasts
39
Argentina and
Chile, Other Areas
16
Market Average
Greatest
Availability
Greatest
Demand
1
2
3
4
5
6
7
8
9
10
11
12
13
14
15
16
17
18
19
20
21
22
23
24
25
26
27
28
29
30
31
32
33
34
35
36
37
38
39
40
41
42
43
44
45
46
47
48
49
50
51
52
50
100
150
Market Average
Greatest
Availability
Greatest
Demand
1
2
3
4
5
6
7
8
9
10
11
12
13
14
15
16
17
18
19
20
21
22
23
24
25
26
27
28
29
30
31
32
33
34
35
36
37
38
39
40
41
42
43
44
45
46
47
48
49
50
51
52
50
100
150
Market Average
Greatest
Availability
Greatest
Demand
1
2
3
4
5
6
7
8
9
10
11
12
13
14
15
16
17
18
19
20
21
22
23
24
25
26
27
28
29
30
31
32
33
34
35
36
37
38
39
40
41
42
43
44
45
46
47
48
49
50
51
52
50
100
150