


 189 / 352

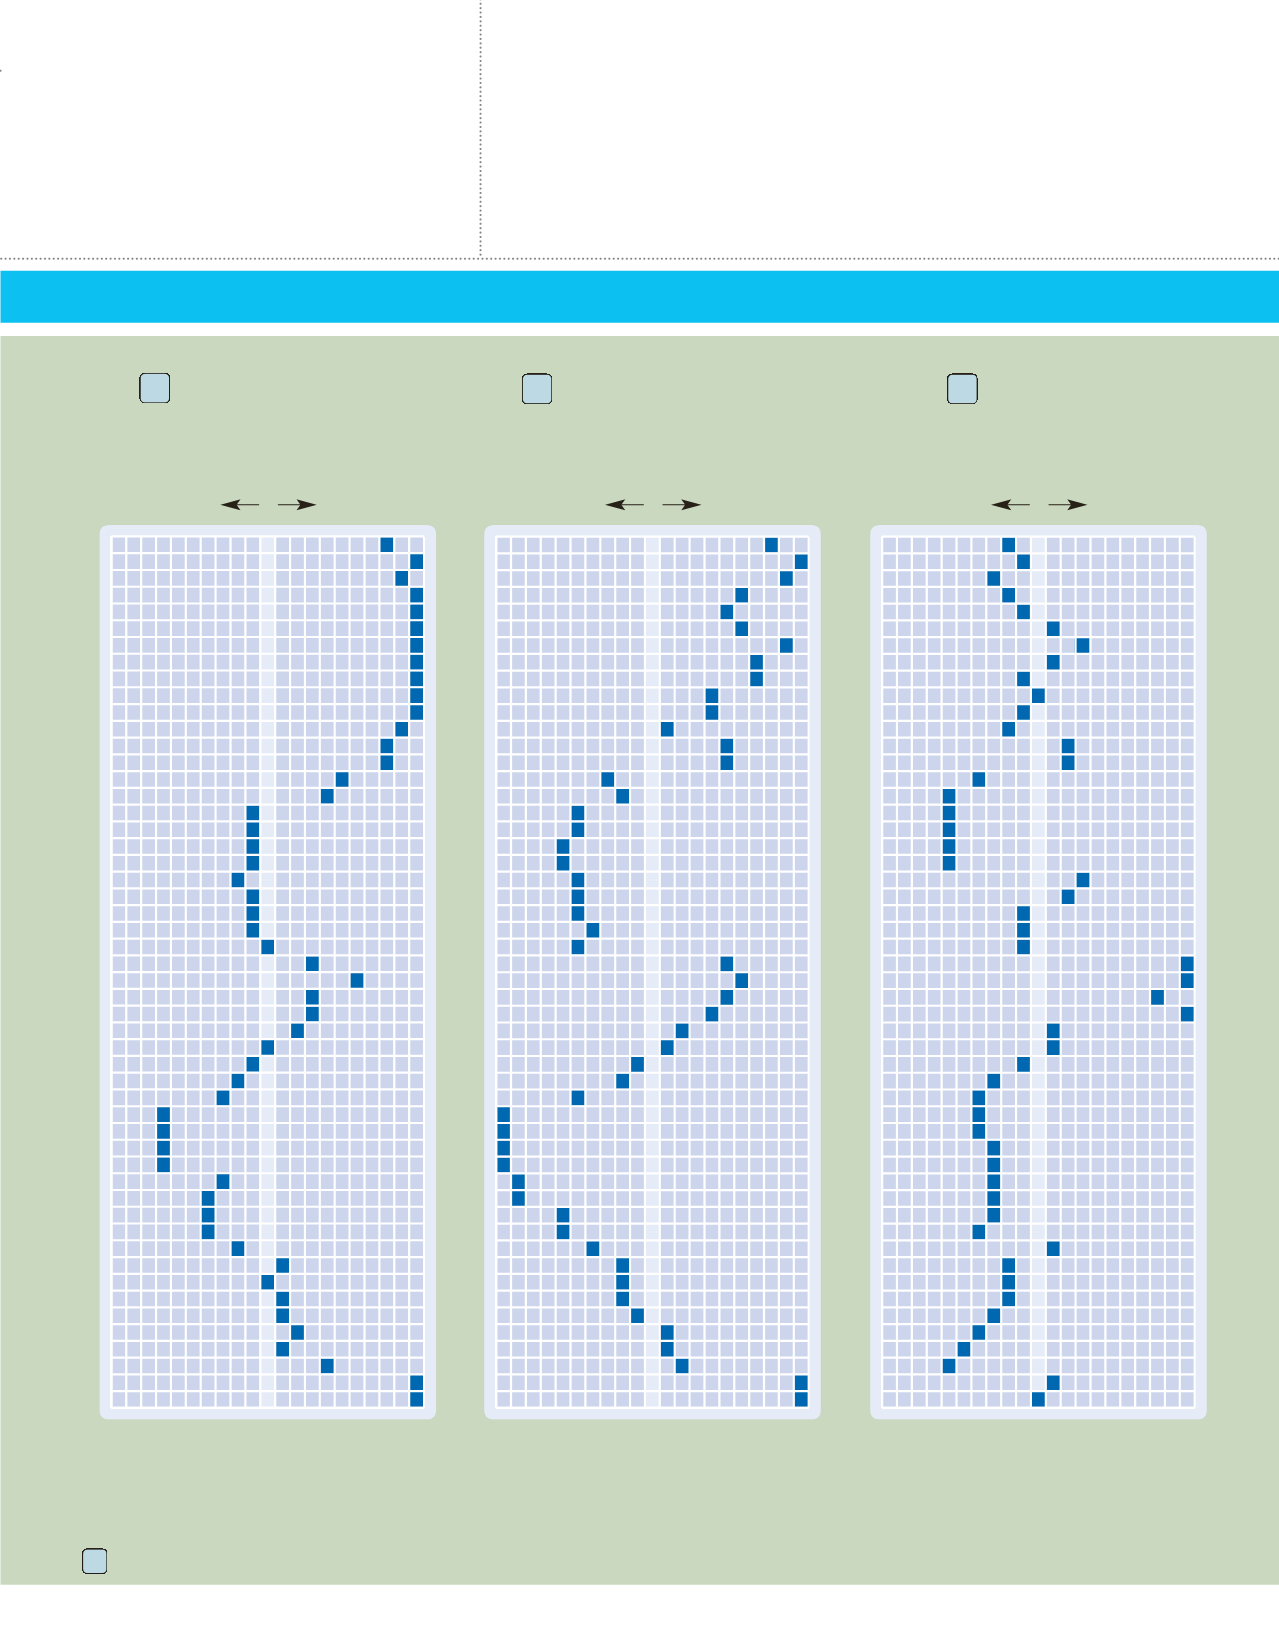
THE TRAVEL DEMAND INDEX
makes it easy to plan the best times to travel. For example, if you want to visit Cancún, the best prices and availability will
be during weeks 35 through 38. During weeks 5 through 7, 9 through 11, 51, and 52, you can expect prices to be higher than average and availabilities to
be more limited.
Each resort listing includes the applicable Travel Demand Index chart number.
TRAVEL DEMAND INDEX
BELIZE
www.travelbelize.orgCOSTA RICA
www.visitcostarica.comEL SALVADOR
www.elsalvador.travelGUATEMALA
www.visitguatemala.comHONDURAS
www.letsgohonduras.comMEXICO
www.visitmexico.com www.cancun.travel www.rivieramaya.com www.discoverbajacalifornia.com www.rivieranayarit.com www.visitpuertovallarta.comPANAMA
www.visitpanama.comMexico, Baja and
Northwestern Coast
38
Mexico,
Southwestern Coast
57
Mexico,
Other Areas
72
Market Average
Market Average
Market Average
Greatest
Availability
Greatest
Availability
Greatest
Availability
Greatest
Demand
Greatest
Demand
Greatest
Demand
1
2
3
4
5
6
7
8
9
10
11
12
13
14
15
16
17
18
19
20
21
22
23
24
25
26
27
28
29
30
31
32
33
34
35
36
37
38
39
40
41
42
43
44
45
46
47
48
49
50
51
52
1
2
3
4
5
6
7
8
9
10
11
12
13
14
15
16
17
18
19
20
21
22
23
24
25
26
27
28
29
30
31
32
33
34
35
36
37
38
39
40
41
42
43
44
45
46
47
48
49
50
51
52
1
2
3
4
5
6
7
8
9
10
11
12
13
14
15
16
17
18
19
20
21
22
23
24
25
26
27
28
29
30
31
32
33
34
35
36
37
38
39
40
41
42
43
44
45
46
47
48
49
50
51
52
50
100
150
50
100
150
50
100
150