


 163 / 352

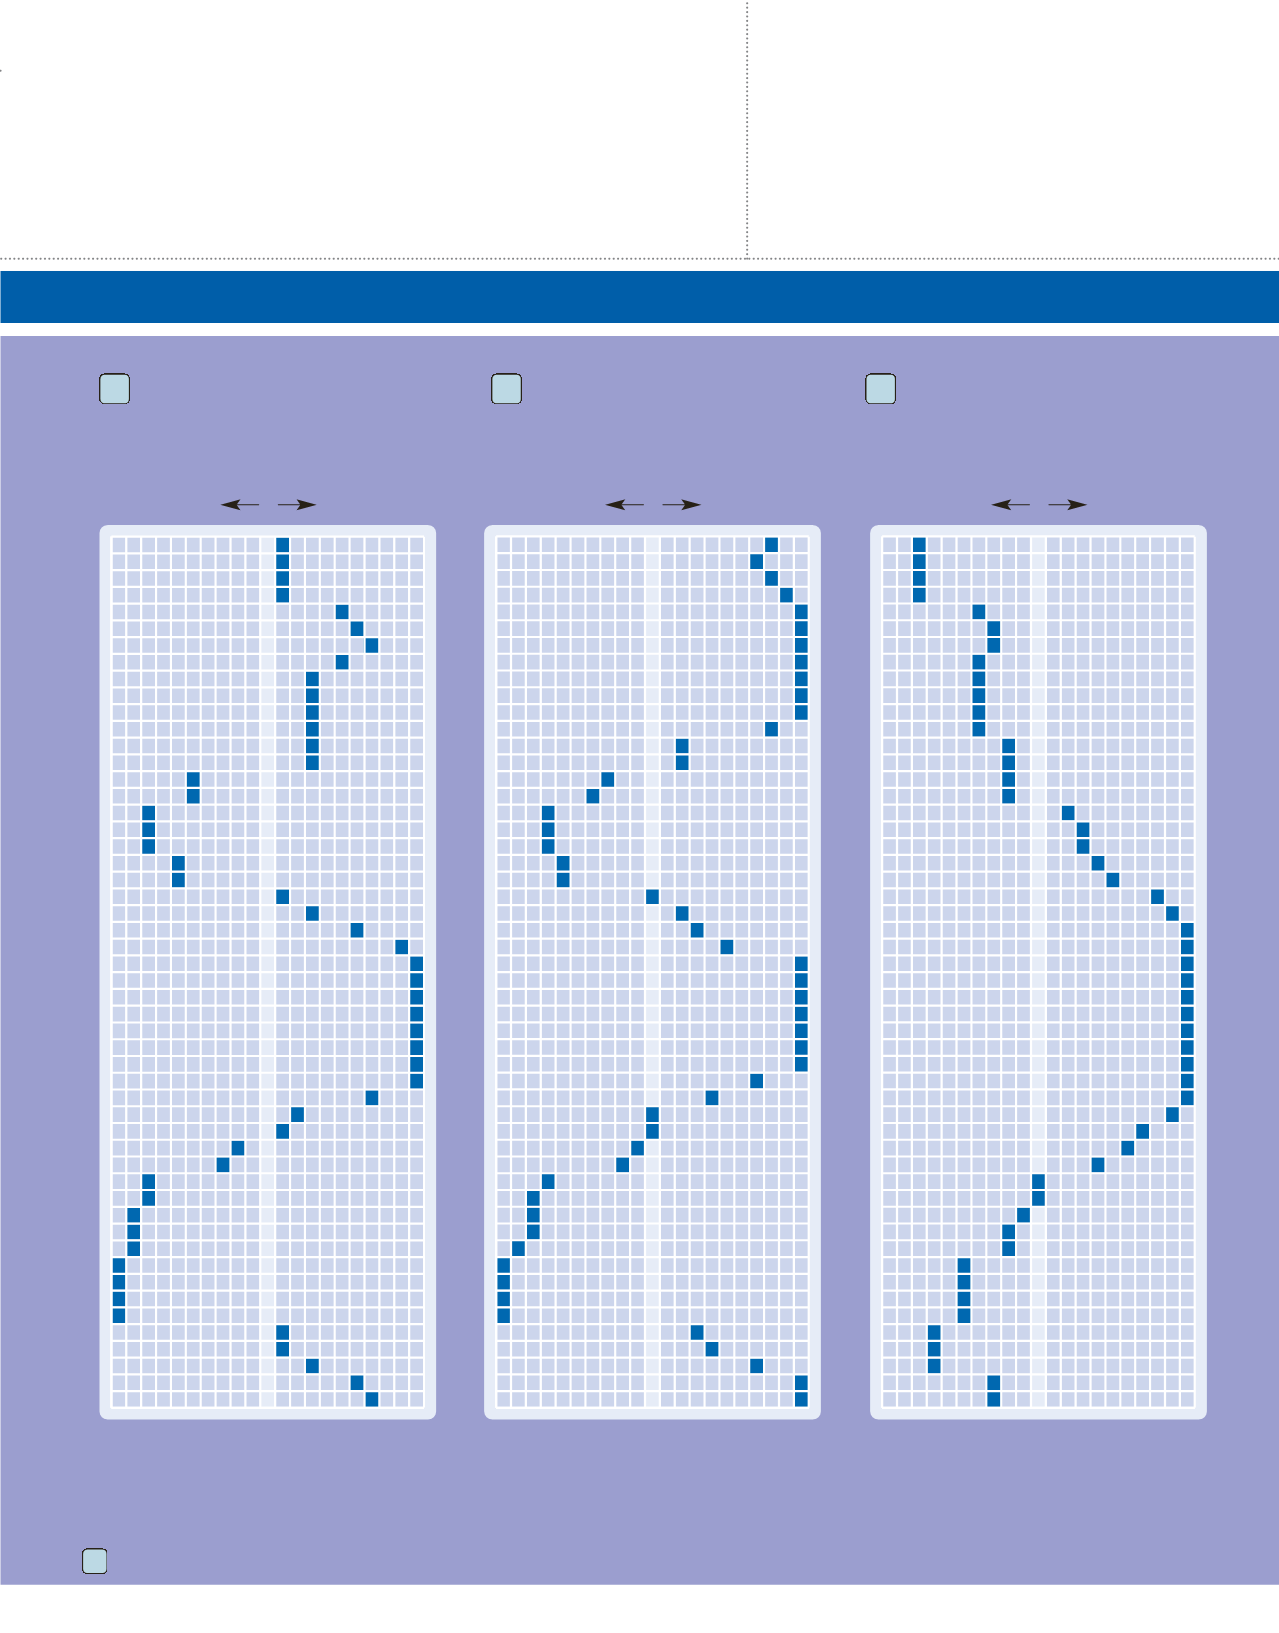
THE TRAVEL DEMAND INDEX
makes it easy to plan the best times to travel. For example, if you want to visit the Canadian Rockies and Western Canada,
the best prices and availability will be during weeks 1 through 4. During weeks 24 through 34, you can expect prices to be higher than average and
availabilities to be more limited.
ALBERTA
www.travelalberta.comBRITISH COLUMBIA
www.hellobc.comNOVA SCOTIA
www.novascotia.comONTARIO
www.ontariotravel.netQUÉBEC
www.bonjourquebec.comEach resort listing includes the applicable Travel Demand Index chart number.
TRAVEL DEMAND INDEX
Western Canada, Ski Areas
Canadian Rockies and
Western Canada, Other Areas
Canadian Rockies, Ski Areas
102
10
34
Market Average
Greatest
Availability
Greatest
Demand
1
2
3
4
5
6
7
8
9
10
11
12
13
14
15
16
17
18
19
20
21
22
23
24
25
26
27
28
29
30
31
32
33
34
35
36
37
38
39
40
41
42
43
44
45
46
47
48
49
50
51
52
50
100
150
Market Average
Greatest
Availability
Greatest
Demand
1
2
3
4
5
6
7
8
9
10
11
12
13
14
15
16
17
18
19
20
21
22
23
24
25
26
27
28
29
30
31
32
33
34
35
36
37
38
39
40
41
42
43
44
45
46
47
48
49
50
51
52
50
100
150
Market Average
Greatest
Availability
Greatest
Demand
1
2
3
4
5
6
7
8
9
10
11
12
13
14
15
16
17
18
19
20
21
22
23
24
25
26
27
28
29
30
31
32
33
34
35
36
37
38
39
40
41
42
43
44
45
46
47
48
49
50
51
52
50
100
150