


 139 / 352

CALIFORNIA
www.visitcalifornia.comOREGON
www.traveloregon.comWASHINGTON
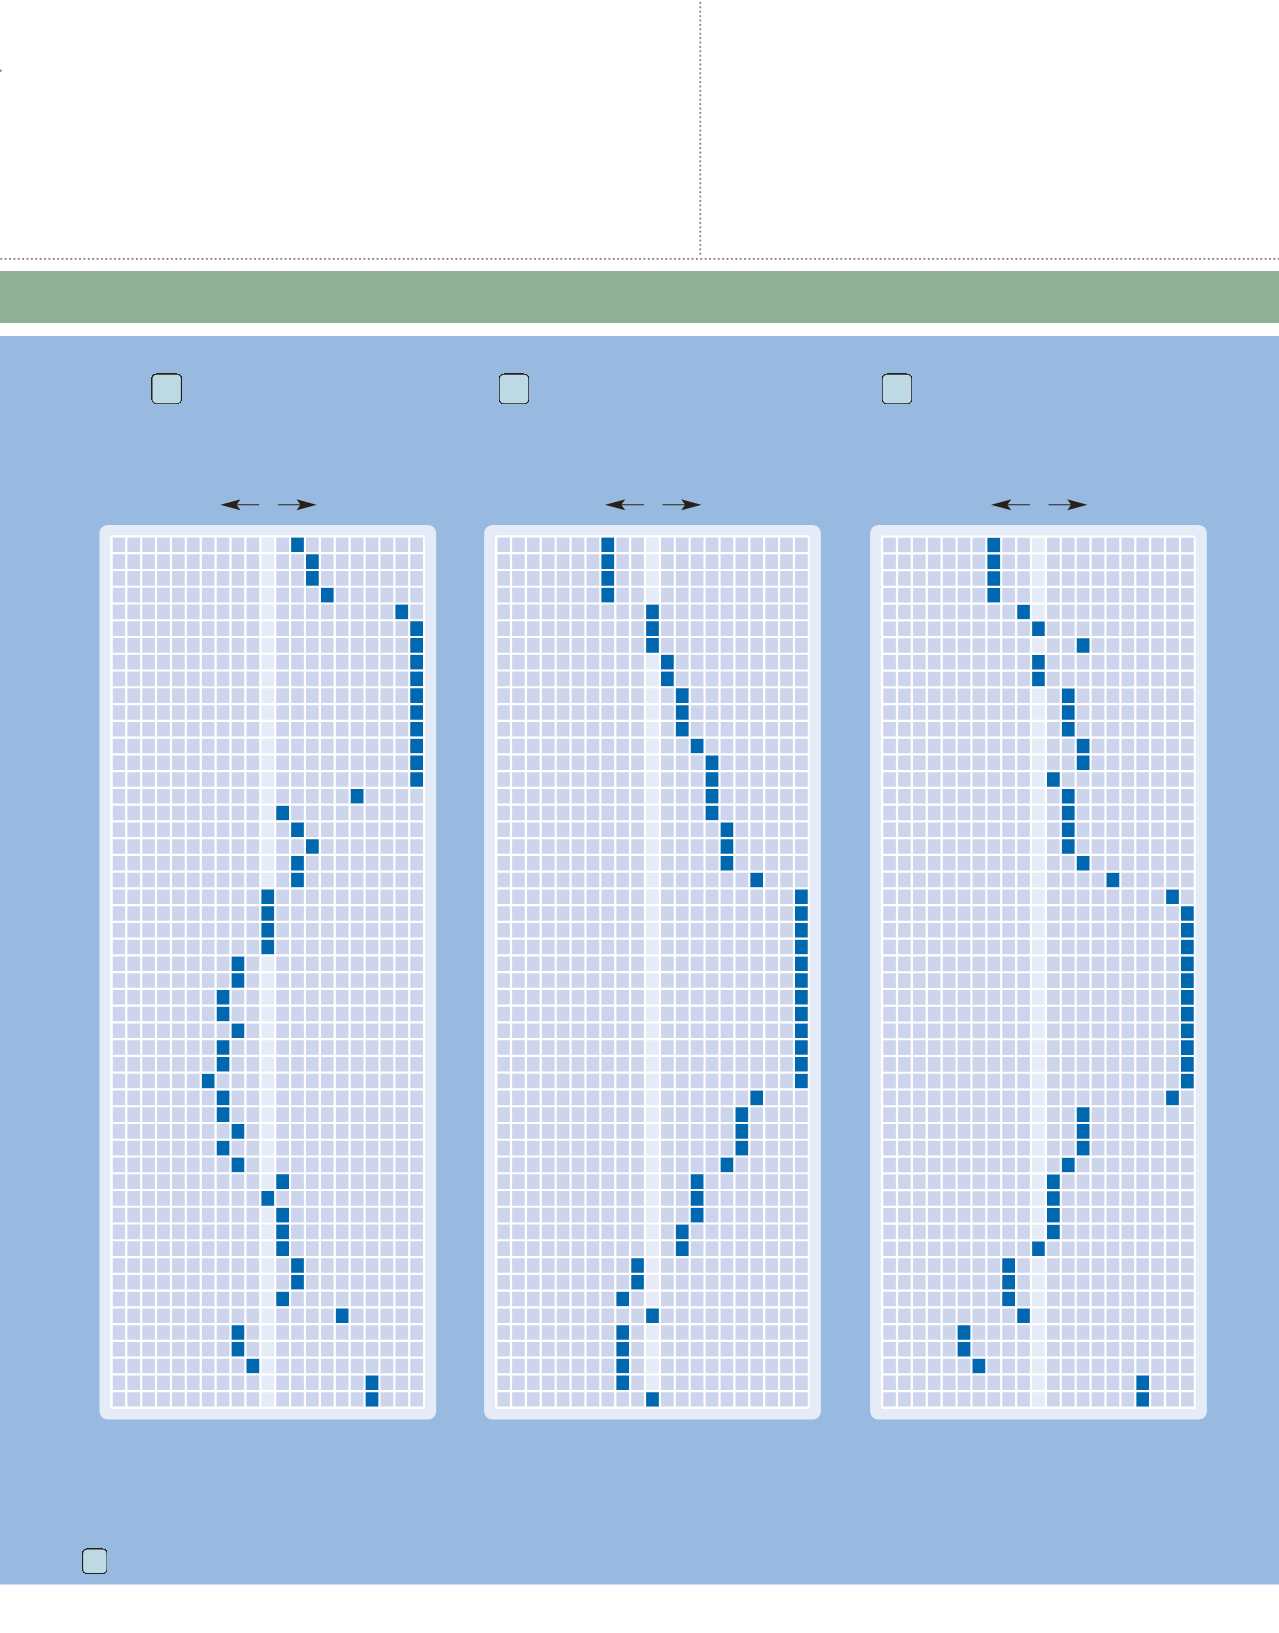
www.experiencewa.comTHE TRAVEL DEMAND INDEX
makes it easy to plan the best times to travel. For example, if you want to visit the California desert, the best prices and
availability will be during week 33. During weeks 6 through 15, you can expect prices to be higher than average and availabilities to be more limited.
Each resort listing includes the applicable Travel Demand Index chart number.
TRAVEL DEMAND INDEX
California, Northern Areas
California, Southern Areas
California, Desert
36
55
70
Market Average
Greatest
Availability
Greatest
Demand
1
2
3
4
5
6
7
8
9
10
11
12
13
14
15
16
17
18
19
20
21
22
23
24
25
26
27
28
29
30
31
32
33
34
35
36
37
38
39
40
41
42
43
44
45
46
47
48
49
50
51
52
50
100
150
Market Average
Greatest
Availability
Greatest
Demand
1
2
3
4
5
6
7
8
9
10
11
12
13
14
15
16
17
18
19
20
21
22
23
24
25
26
27
28
29
30
31
32
33
34
35
36
37
38
39
40
41
42
43
44
45
46
47
48
49
50
51
52
50
100
150
Market Average
Greatest
Availability
Greatest
Demand
1
2
3
4
5
6
7
8
9
10
11
12
13
14
15
16
17
18
19
20
21
22
23
24
25
26
27
28
29
30
31
32
33
34
35
36
37
38
39
40
41
42
43
44
45
46
47
48
49
50
51
52
50
100
150