


 129 / 352

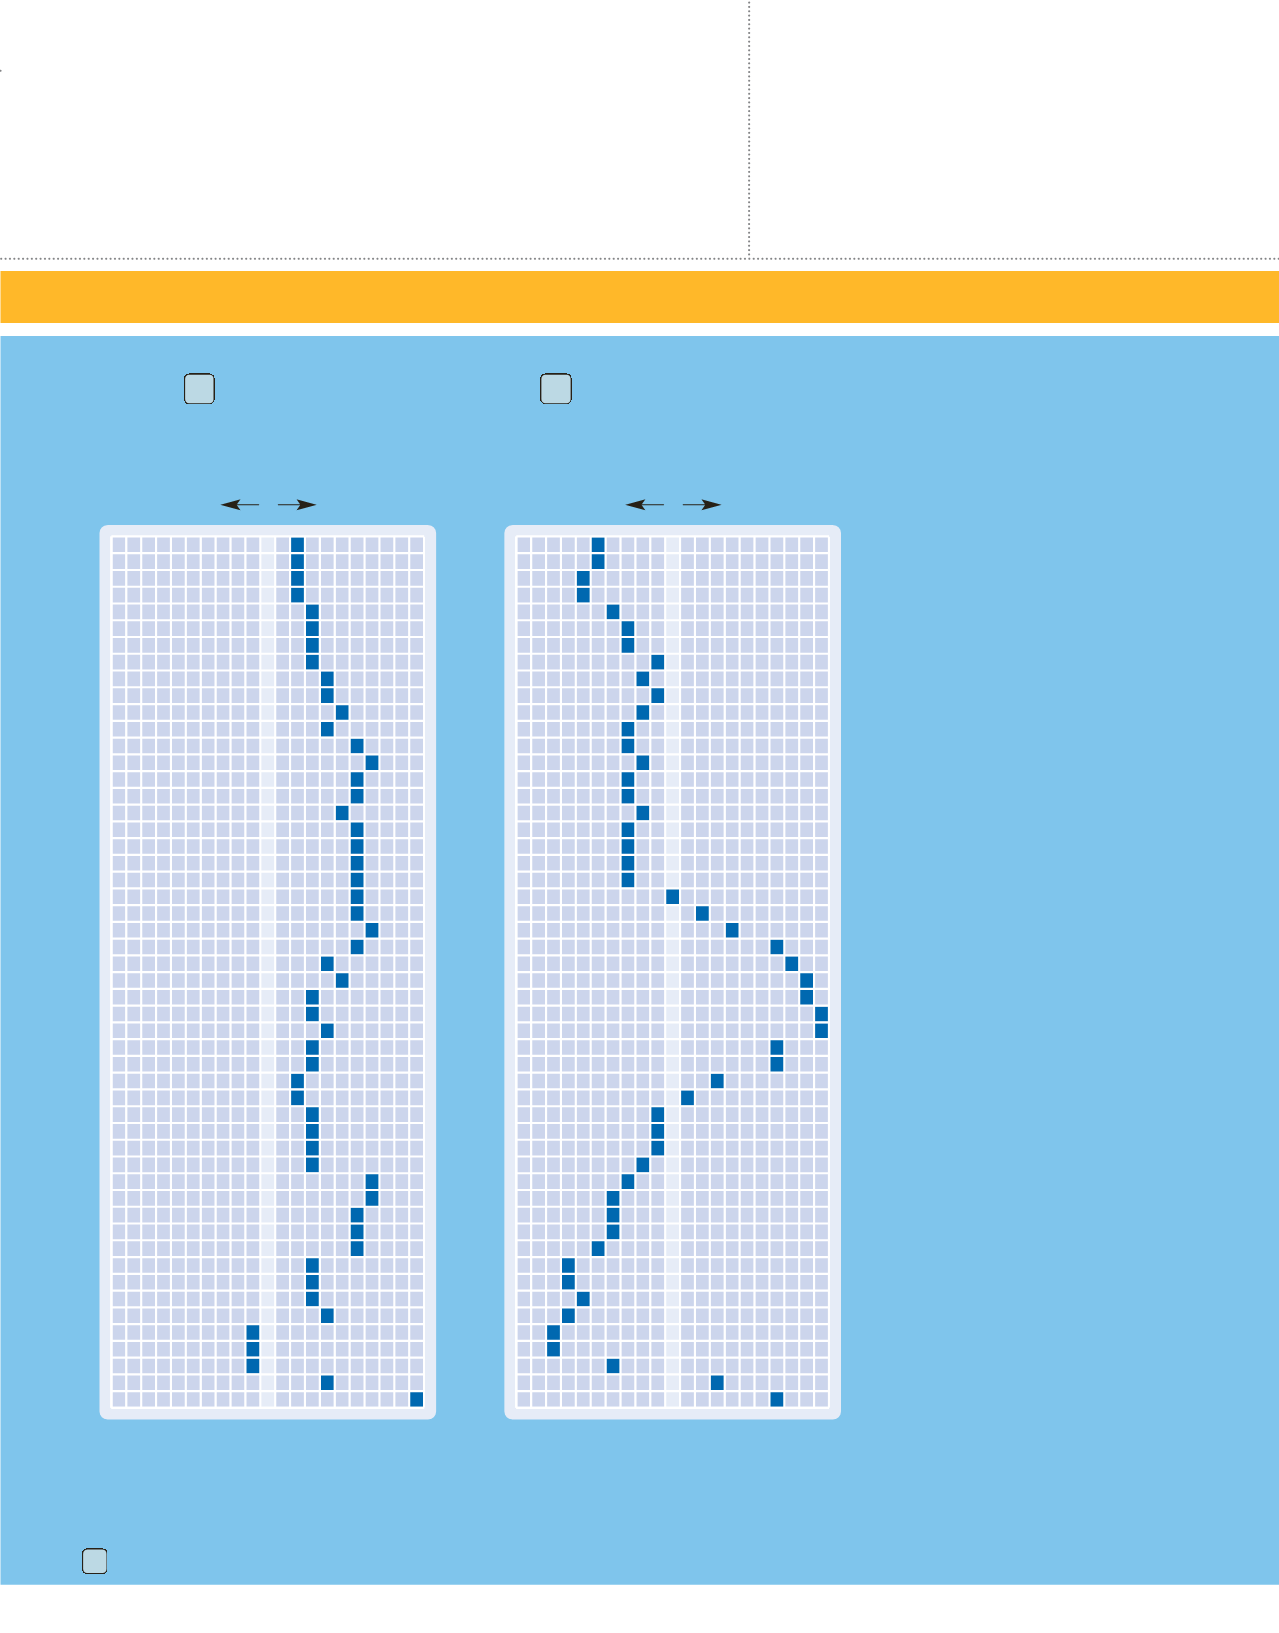
THE TRAVEL DEMAND INDEX
makes it easy to plan the best times to travel. For example, if you want to visit Lake Tahoe, the best prices and availability
will be during weeks 44 and 45. During weeks 7, 25 through 32, 51, and 52, you can expect prices to be higher than average and availabilities to be more
limited.
CALIFORNIA
www.visitcalifornia.comNEVADA
www.travelnevada.comEach resort listing includes the applicable Travel Demand Index chart number.
TRAVEL DEMAND INDEX
Reno/Mesquite and
Nevada, Other Areas
Las Vegas
35
54
Market Average
Greatest
Availability
Greatest
Demand
1
2
3
4
5
6
7
8
9
10
11
12
13
14
15
16
17
18
19
20
21
22
23
24
25
26
27
28
29
30
31
32
33
34
35
36
37
38
39
40
41
42
43
44
45
46
47
48
49
50
51
52
50
100
150
Market Average
Greatest
Availability
Greatest
Demand
1
2
3
4
5
6
7
8
9
10
11
12
13
14
15
16
17
18
19
20
21
22
23
24
25
26
27
28
29
30
31
32
33
34
35
36
37
38
39
40
41
42
43
44
45
46
47
48
49
50
51
52
50
100
150