


 107 / 352

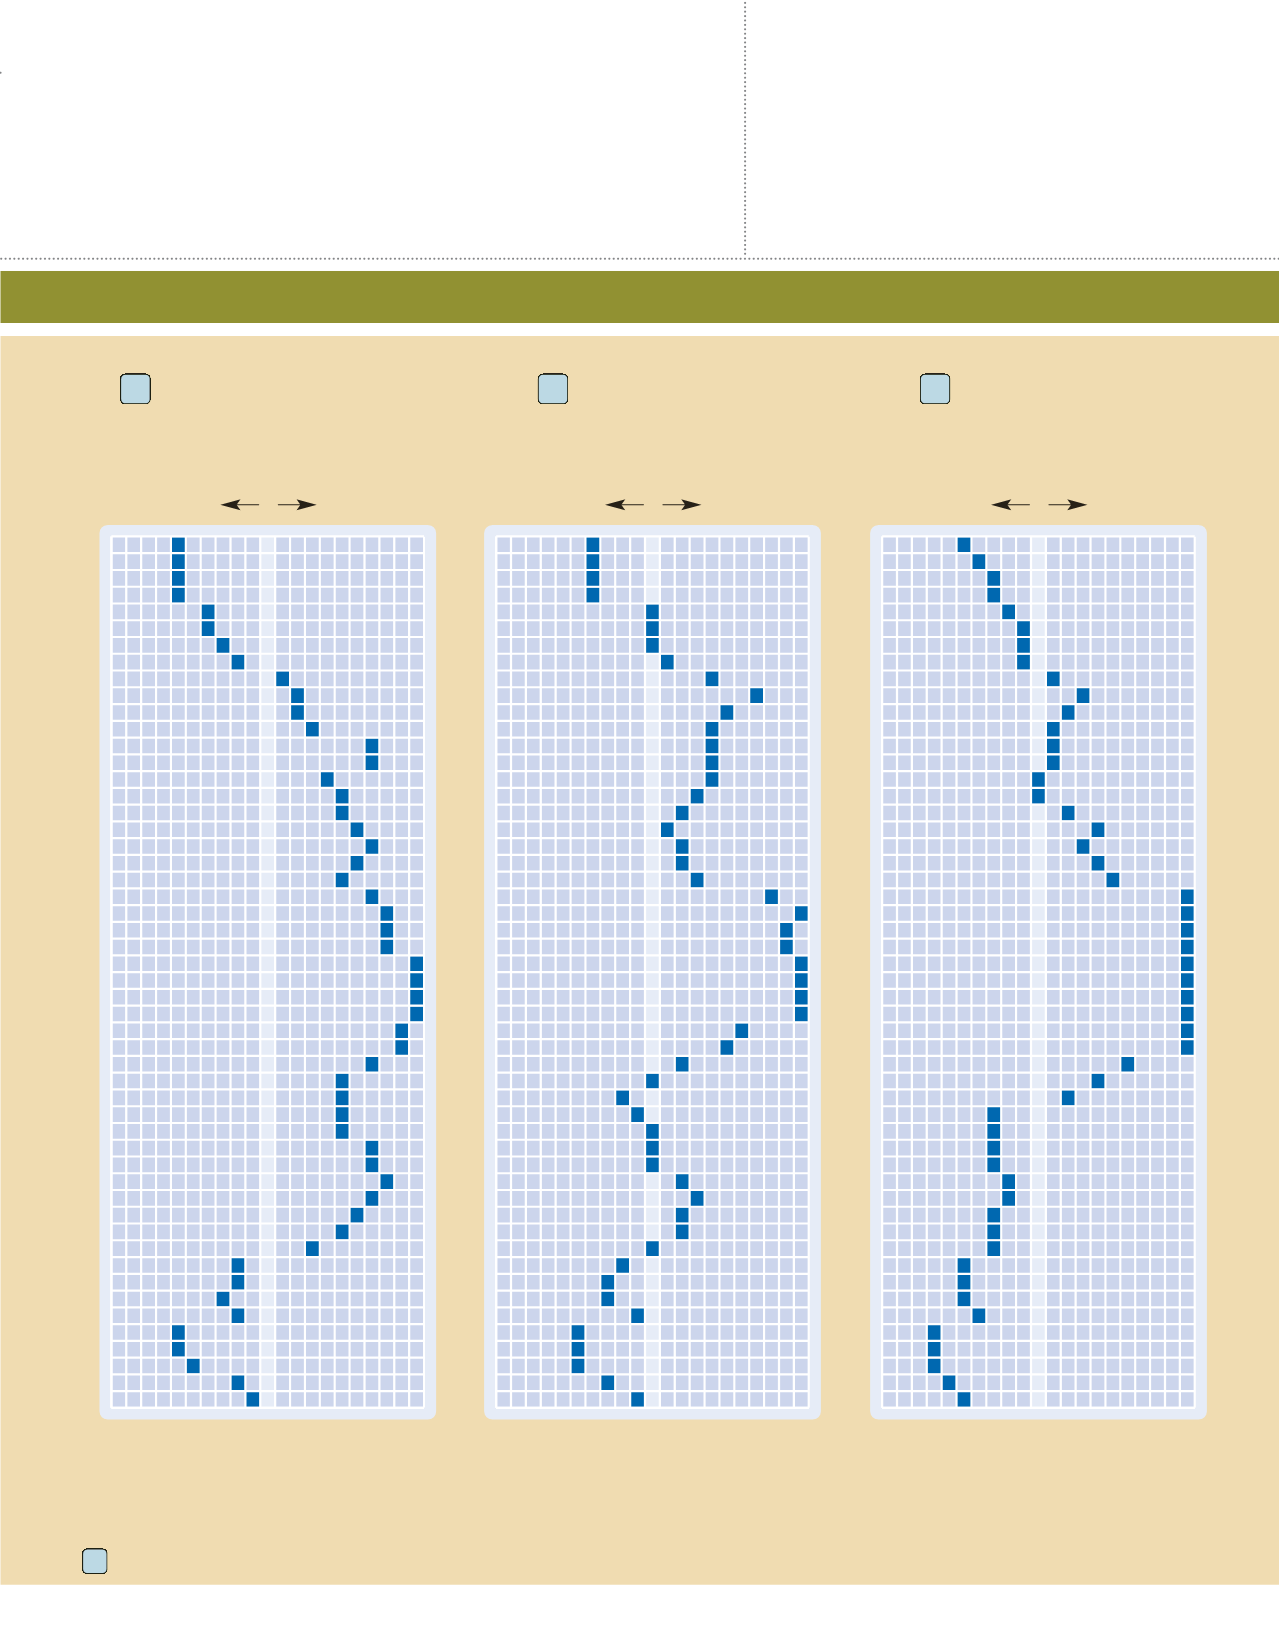
THE TRAVEL DEMAND INDEX
makes it easy to plan the best times to travel. For example, if you want to visit the mountains of Arizona or New Mexico,
the best prices and availability will be during weeks 1 through 4 and 48 and 49. During weeks 26 through 29, you can expect prices to be higher than
average and availabilities to be more limited.
ARIZONA
www.arizonaguide.comNEW MEXICO
www.newmexico.orgOKLAHOMA
www.travelok.comTEXAS
www.traveltex.comEach resort listing includes the applicable Travel Demand Index chart number.
TRAVEL DEMAND INDEX
Texas, Hill Country
and Inland Areas
Texas, Gulf Coast
Arizona and
New Mexico, Mountains
32
52
69
Market Average
Greatest
Availability
Greatest
Demand
1
2
3
4
5
6
7
8
9
10
11
12
13
14
15
16
17
18
19
20
21
22
23
24
25
26
27
28
29
30
31
32
33
34
35
36
37
38
39
40
41
42
43
44
45
46
47
48
49
50
51
52
50
100
150
Market Average
Greatest
Availability
Greatest
Demand
1
2
3
4
5
6
7
8
9
10
11
12
13
14
15
16
17
18
19
20
21
22
23
24
25
26
27
28
29
30
31
32
33
34
35
36
37
38
39
40
41
42
43
44
45
46
47
48
49
50
51
52
50
100
150
Market Average
Greatest
Availability
Greatest
Demand
1
2
3
4
5
6
7
8
9
10
11
12
13
14
15
16
17
18
19
20
21
22
23
24
25
26
27
28
29
30
31
32
33
34
35
36
37
38
39
40
41
42
43
44
45
46
47
48
49
50
51
52
50
100
150