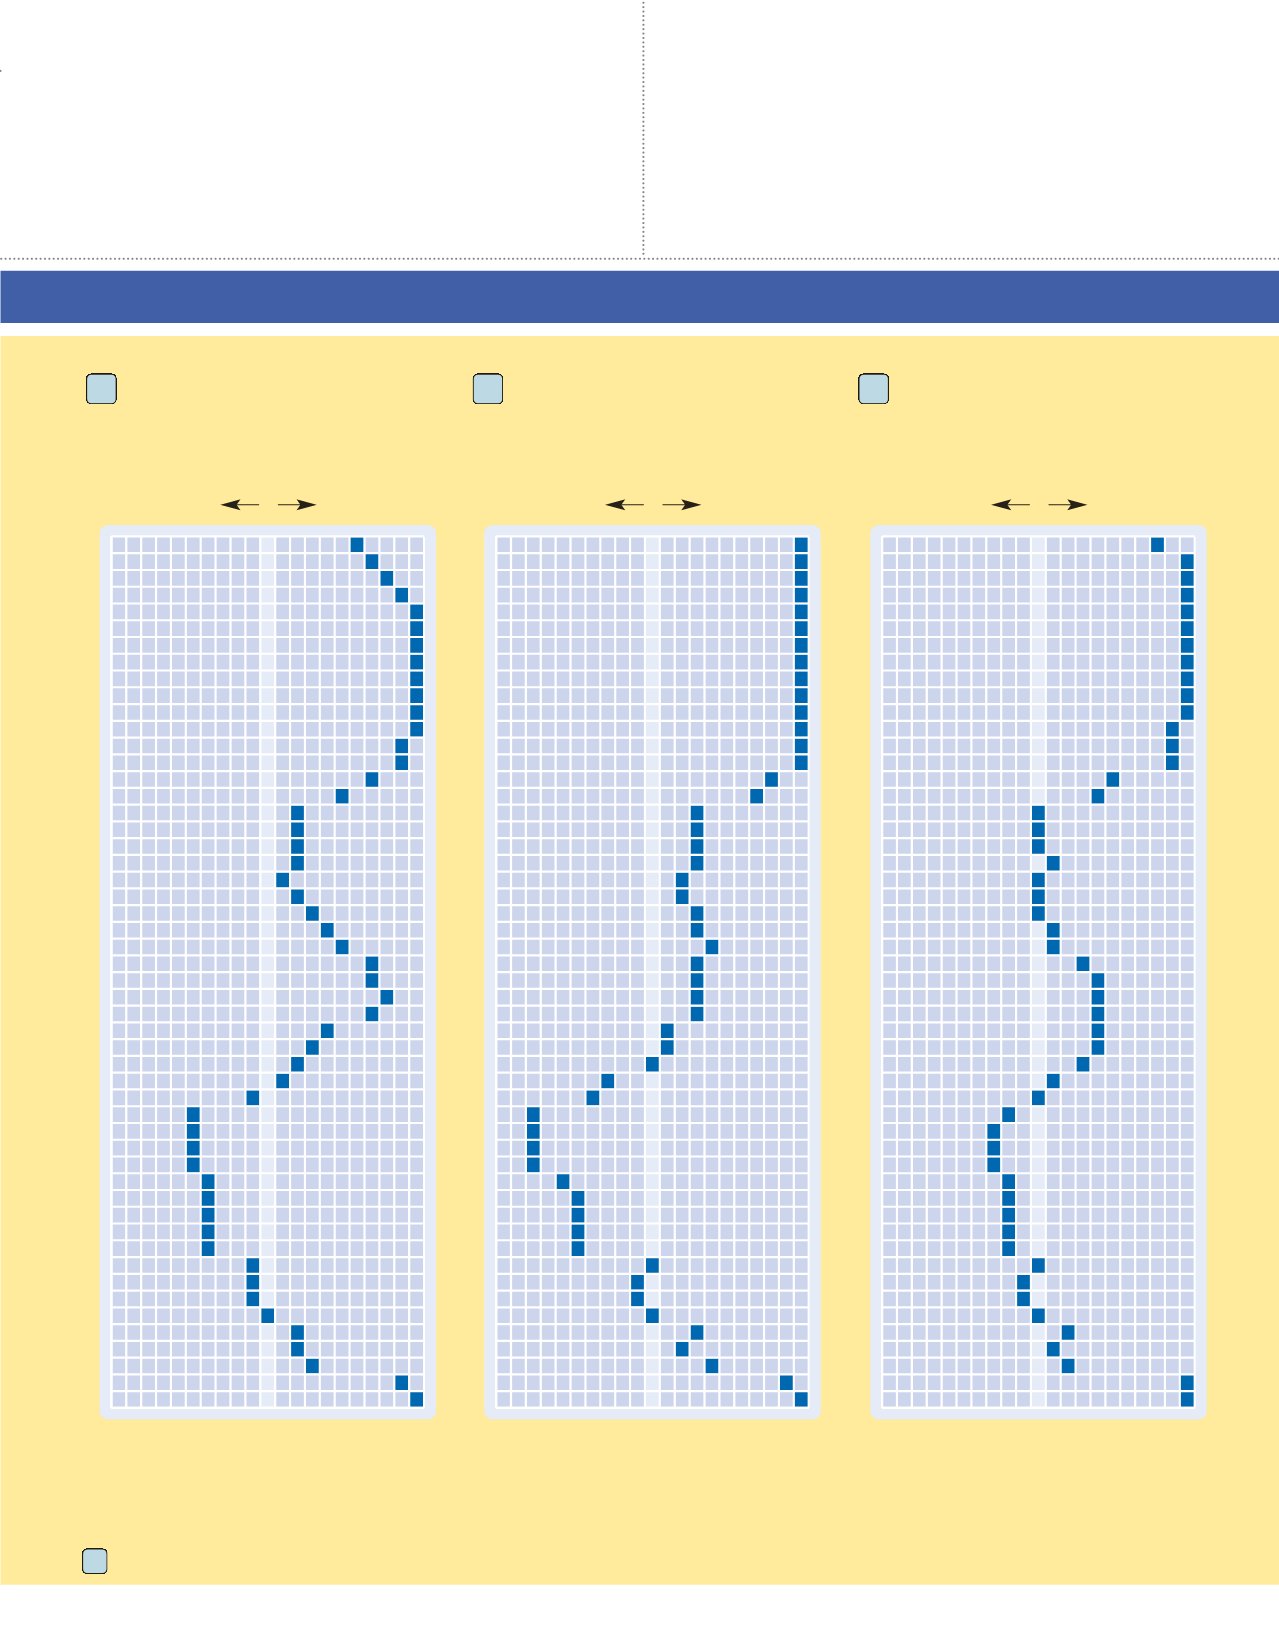
THE TRAVEL DEMAND INDEX
makes it easy to plan the best times to travel. For example, if you want to visit Margarita Island, the best prices and availability
will be during weeks 36 through 38. During weeks 2 through 11, 51, and 52, you can expect prices to be higher than average and availability to be more limited.
ANGUILLA
ANTIGUA
ARUBA
BAHAMAS
BARBADOS
BERMUDA
BONAIRE
CAYMAN ISLANDS
CURAÇAO
DOMINICA
DOMINICAN REPUBLIC
GRENADA
Each resort listing includes the applicable Travel Demand Index chart number.
TRAVEL DEMAND INDEX
JAMAICA
MARGARITA ISLAND
PUERTO RICO
ST. JOHN
ST. KITTS AND NEVIS
ST. LUCIA
ST. MAARTEN/ST. MARTIN
ST. THOMAS
TORTOLA
TURKS AND CAICOS
Caribbean,
Northern and Western Islands
Caribbean,
Leeward and Windward Islands
Caribbean,
Southern Islands and Margarita
56
71
78
Market Average
Market Average
Market Average
Greatest
Availability
Greatest
Availability
Greatest
Availability
Greatest
Demand
Greatest
Demand
Greatest
Demand
1
2
3
4
5
6
7
8
9
10
11
12
13
14
15
16
17
18
19
20
21
22
23
24
25
26
27
28
29
30
31
32
33
34
35
36
37
38
39
40
41
42
43
44
45
46
47
48
49
50
51
52
1
2
3
4
5
6
7
8
9
10
11
12
13
14
15
16
17
18
19
20
21
22
23
24
25
26
27
28
29
30
31
32
33
34
35
36
37
38
39
40
41
42
43
44
45
46
47
48
49
50
51
52
1
2
3
4
5
6
7
8
9
10
11
12
13
14
15
16
17
18
19
20
21
22
23
24
25
26
27
28
29
30
31
32
33
34
35
36
37
38
39
40
41
42
43
44
45
46
47
48
49
50
51
52
50
100
150
50
100
150
50
100
150


